Hunt versus headroom

Rob Calvert Jump and Jo Michell

Just over a year ago, ahead of Jeremy Hunt’s first Autumn Statement, we published a report on how UK public finances are managed and discussed. At the time, the media was awash with claims of a ‘black hole’ in the public finances. We pointed out that this was incoherent because the so-called black hole was nothing more than the difference between an arbitrary fiscal rule and an uncertain forecast.

We also pointed out that forecasts of public debt are highly sensitive to the assumed path of variables such as nominal GDP growth. The latest Autumn Statement and its accompanying OBR projections provide a case in point.

In the run up to the Statement, the media focus had switched from black holes to ‘fiscal headroom‘. This was reported to be around £20bn, and is a measure of the size of the fall in the public debt in the fifth year of the OBR’s forecast – a ‘black hole’ with the sign reversed.

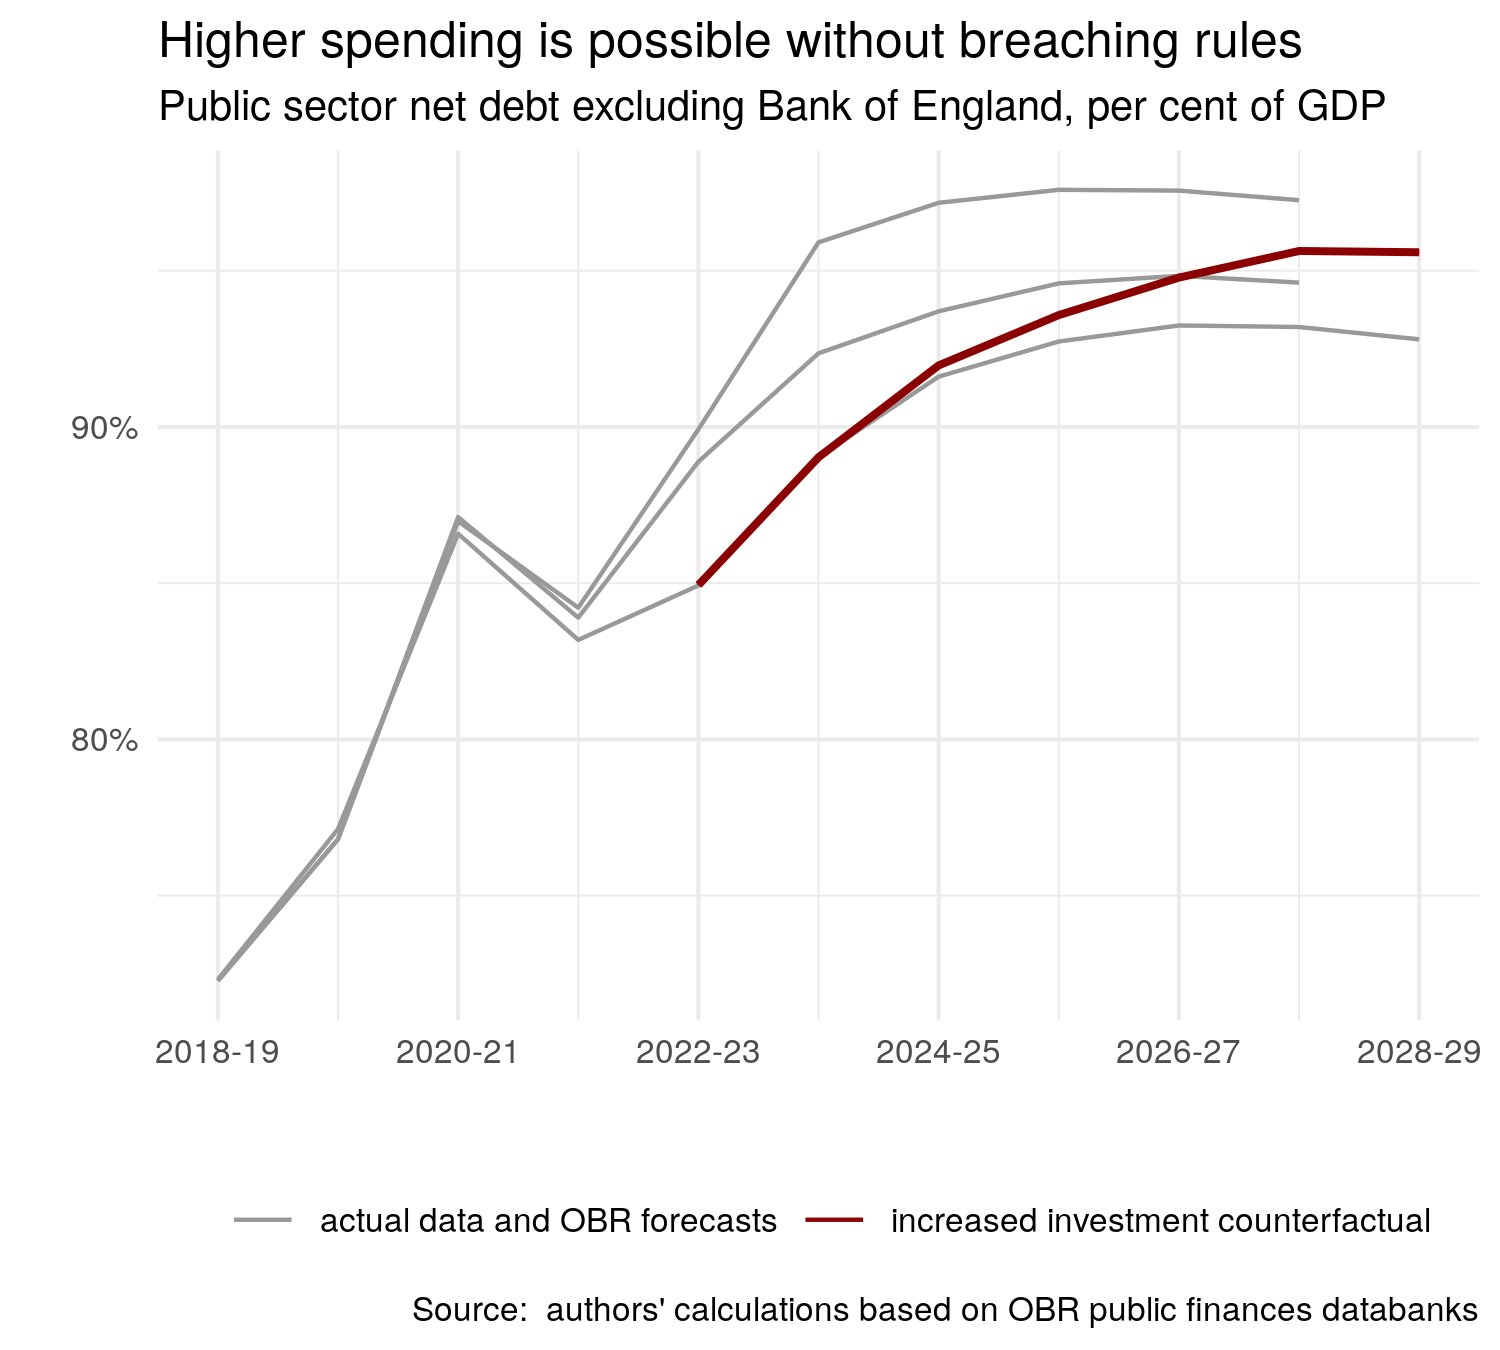
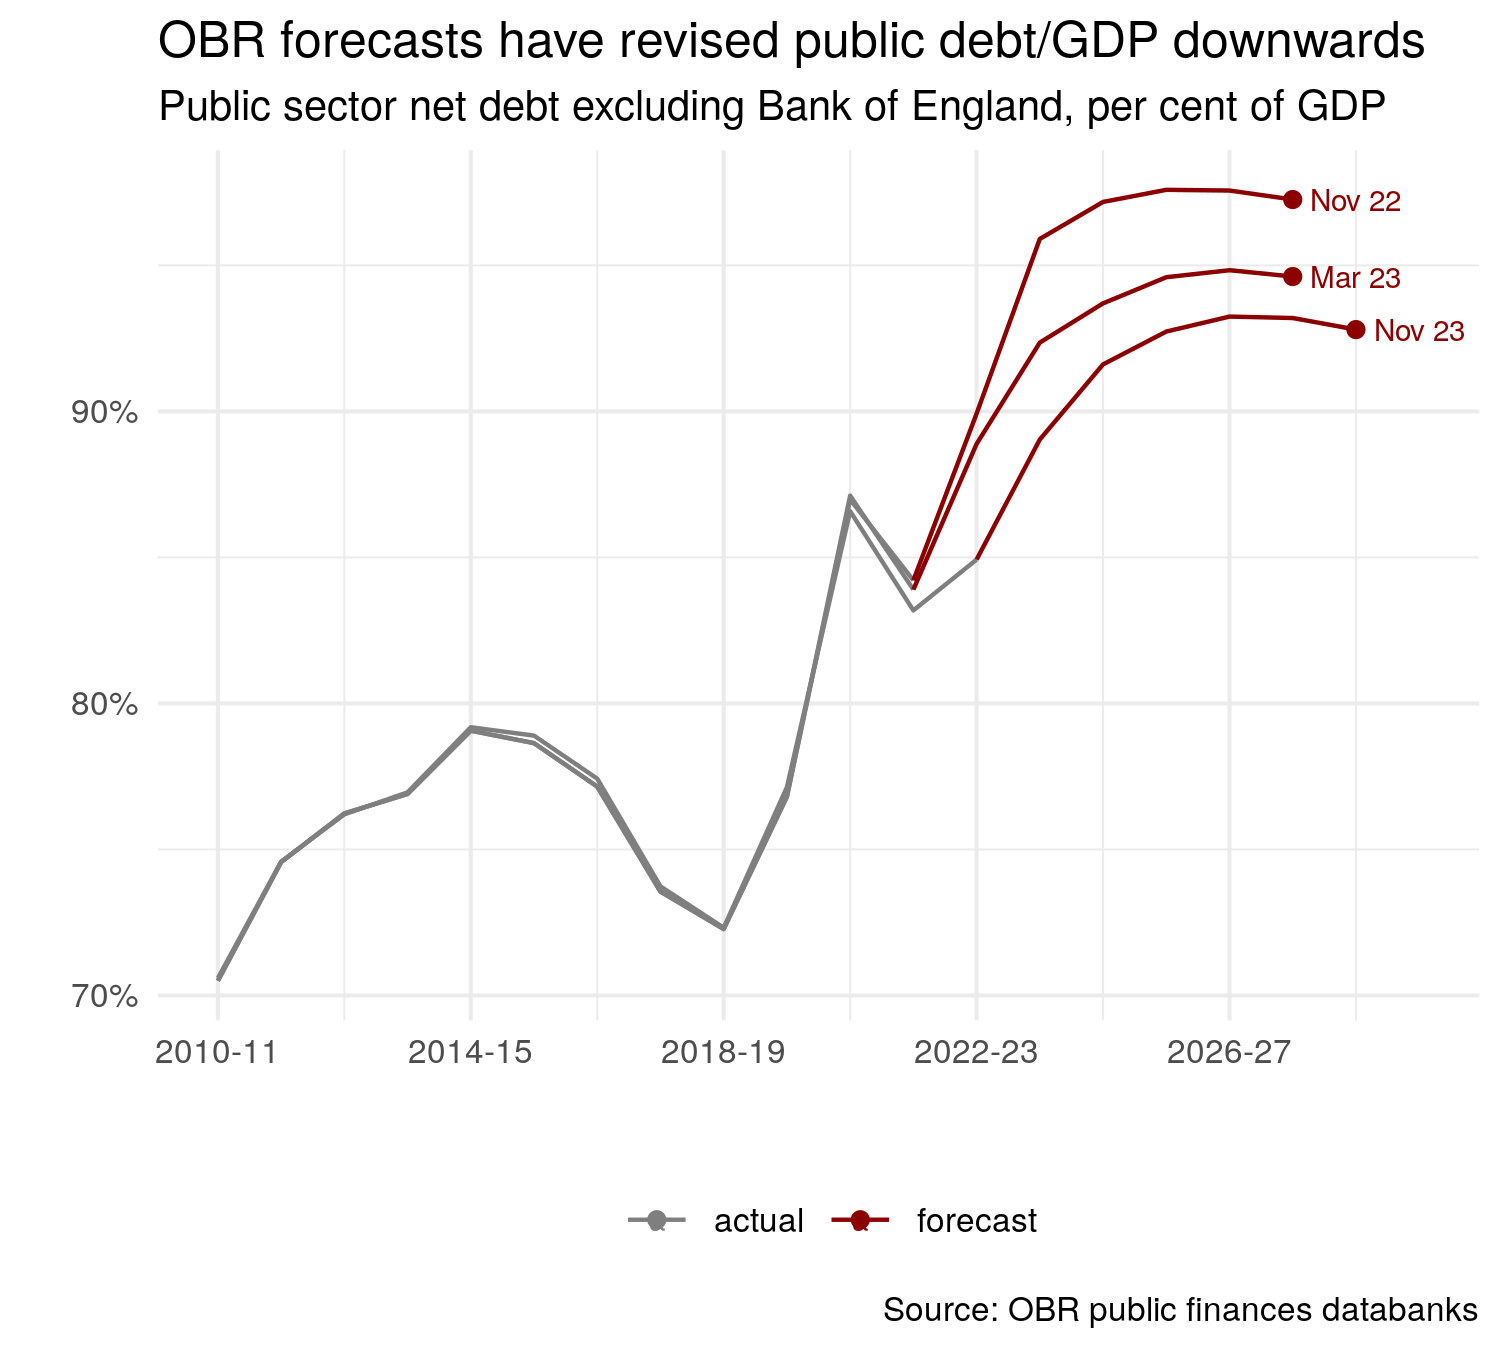
The figure below shows the last three forecasts of public debt from the OBR, along with the historical data published at the time of the forecast. Since the Autumn Statement a year ago, the level of public debt in the final year of the forecasts has fallen from 97.3% of GDP in the November 2022 forecast, to 92.8% of GDP in the most recent one. This forecast revision amounts to nearly £150bn of 2028-29 GDP.

Figure of OBR debt to GDP forecasts

Is this £150bn improvement in the forecast the result of policy actions taken by the government? And if so, why is all the talk of £20bn of headroom, rather than £150bn? The answer to the first question is a firm ‘no’. These shifts in the forecast have nothing to do with policy, and are driven entirely by data revisions and changes in the OBR’s macroeconomic forecasts.

Recent revisions to GDP have shown a stronger recovery from the pandemic than previously thought, alongside higher than expected inflation. As a result, nominal GDP is substantially higher than it was a year ago, and so the debt to GDP ratio is lower. 

In the space of a year, data revisions and revised expectations about inflation have, therefore, swamped any change in the debt level driven by policy. Shifts in the positions of the series are far greater than the marginal change between the final two data points – the so-called ‘headroom’ which receives so much attention.

What about the second question? Why are we not talking about £150bn of headroom? The answer to this is unclear, but it is probably the case that the Chancellor of the Exchequer is not actively considering every possible trajectory for the public debt that satisfies his fiscal rules. If he did so, he could substantially increase public spending in a manner that would leave debt falling, as a percentage of GDP, by the end of the OBR’s forecast period.

Consider, for example, the OBR’s November 2023 forecasts for the main fiscal aggregates, displayed in the table below. Public sector net debt, as a percentage of GDP, falls from 93.2% in 2027-28 to 92.8% in 2028-29. Public sector net borrowing is less than 3% of GDP in 2028-29. As a result, the government’s two fiscal targets are met.

yeargdpgdp_centredpsndpsnbgilt_ratepsnd_pctpsnb_pct
2022-23255226502251128.33.1384.945.03
2023-24272627612458123.94.589.034.55
2024-2527982841260384.64.5291.623.02
2025-2628872938272476.84.5592.722.66
2026-2729953051284568.44.6293.252.28
2027-2831063162294749.14.7493.21.58
2028-2932183274303935.04.8892.821.09
OBR forecasts in the November 2023 Economic and Fiscal Outlook.

Now, consider a counterfactual increase in public investment, by £10bn in 2024-25, £15bn in 2025-26, £20bn in 2026-27, £28bn in 2027-28, and then £10bn in 2028-29. This looks something like the Labour Party’s proposed green new deal, in which annual public investment would increase to £28bn over a single parliament. For simplicity we assume multipliers of zero and no impact on inflation, so that nominal GDP is unchanged from the OBR forecasts.

How would this affect public sector borrowing? In 2024-25, it would increase (relative to the OBR’s baseline forecast in table 1) by £10bn. In 2025-26 it would increase by £15bn plus interest payments on the previous year’s £10bn. In 2026-27 it would increase by a further £20bn, plus interest payments on the previous two years’ borrowing, and so on. The resulting time paths for borrowing and debt are displayed in table 2, below.

yeargdpgdp_centredpsndpsnbgilt_ratepsnd_pctpsnb_pct
2022-23255226502251128.33.1384.945.03
2023-24272627612458123.94.589.034.55
2024-2527982841261394.64.5291.973.38
2025-26288729382749.4692.264.5593.583.2
2026-27299530512891.6389.584.6294.782.99
2027-28310631623023.8479.314.7495.632.55
2028-29321832743129.5948.754.8895.591.51
Counterfactual government spending path based on OBR forecasts.

Public sector net debt, as a percentage of GDP, now peaks at a higher level: 95.63% rather than 93.25%.  But it is still falling between 2027-28 and 2028-29, and public sector net borrowing is still less than 3% of GDP in 2028-29. As a result, the government’s fiscal targets are still met.

This counterfactual trajectory of debt-to-GDP, alongside the OBR’s recent forecasts are plotted in the figure below. Our counterfactual trajectory is not dissimilar to the OBR’s forecast from March 2023. The end of forecast debt/GDP is around two percentage points of GDP lower than in the November 22 forecast, in which Hunt had defeated the black hole and met his fiscal rules. Given that this was regarded as a success only a year ago, on what basis could our counterfactual trajectory be rejected?

Counterfactual debt to GDP scenario

It is clear that ‘headroom’ as reported in the media is not simply a measure of the amount of money that the Chancellor could spend without breaching his fiscal rules. In fact, given its complicated nature, there is no single number that summarises the amount of extra spending consistent with a headline fiscal rule defined by the rate of change of debt-to-GDP at a future point in time. It depends on the distribution of extra spending over the forecast period, as well as the time path of interest rates.

Moreover – and this is, perhaps, more important – it depends on the volatility of the forecasts themselves. The difficulties involved in forecasting economic and fiscal aggregates over a five year horizon is illustrated by pre-budget forecasting exercises published by the Institute of Fiscal Studies and the Resolution Foundation. Their estimates of public debt as a share of GDP at the end of the forecast period differ by nearly 10 percentage points – over £300bn. Minor adjustments to the assumptions that generate these forecasts lead to outcomes an order of magnitude greater than the ‘headroom’ which attracts so much attention.

This is not a rational basis on which to conduct the planning of long-term spending and taxation. It is clear that Hunt’s budget is an exercise in gaming the system. Current nominal tax cuts are ‘paid for’ by creating ‘headroom’ which results from imprecisely specified cuts to government spending towards the end of the forecast period. Moreover, the widely-quoted ‘headroom’ figures have no correspondence whatsoever to the amount of extra money the Chancellor could spend while meeting his rules, and any policy effects are swamped by revisions to the data and forecasts. 

As Paul Johnson, head of the Institute for Fiscal studies says, “Aiming for debt to fall in a particular year is not a good fiscal rule”. Simon Wren-Lewis puts it even more bluntly: “falling debt to GDP is a silly rule”.

G7 growth rates and austerity

Rob Calvert Jump and Jo Michell

In August 2022, revisions to official measures of UK output generated headlines because the new figures implied that the economic contraction during the pandemic was greater than previously thought. 

At the same time, however, substantial revisions were made to historical data, and these received far less attention. One outcome of these revisions is that the UK’s performance relative to other rich economies during the austerity period of 2010–2016 has been downgraded: growth in real GDP per capita over this period is now meaningfully lower. This means that some recent analyses relying on the older figures are misleading.

For example, in a recent FT article, Chris Giles includes data showing that the UK had the highest growth of real GDP per head in the G7 between 2010 and 2016. Inevitably, the article was circulated by defenders of austerity including Rupert Harrison and Tim Pitt, alongside a claim that the data “shows why the idea austerity has caused our growth problems post-GFC doesn’t stack up. During peak austerity (2010-6) UK had strongest GDP per capita growth in G7”.

The data used by Chris Giles are from the International Monetary Fund’s (IMF) October 2022 World Economic Outlook (WEO), and show average annual growth in real GDP per head of 1.4% in the UK between 2010 and 2016, compared with 1.3% in both Germany and the USA. But the October 2022 WEO uses data from the 2021 Blue Book, which were compiled before the most recent set of revisions were introduced.

The 2021 data imply that total per capita growth between 2010 and 2016 was 8.39% in the UK, compared with 8.36% in Germany and 8.27% in the USA. On these numbers, the UK is indeed the highest, albeit by a margin in the second decimal place: under a billion pounds separates the UK and Germany. (This very slim margin appears larger in the FT chart due to growth rates being annualised and then rounded to 1 decimal place, implying UK growth of 8.7% versus German growth of 8.1%, a difference of 0.6 percentage points rather than the actual difference in the IMF data of 0.03 percentage points.)

However, according to the revised figures, real per capita growth in the UK over this period was only 7.7%: total nominal GDP growth between 2010 and 2016 was revised down by around one percentage point in the 2022 data, culminating in lower cash GDP of around £17 billion by 2016.  Smaller adjustments to inflation estimates mean that real GDP growth was revised down by around 0.7 percentage points, from 13.4% to 12.7%. Alongside unchanged population estimates, the result is that official real GDP per capita was revised down by around £340 (in 2019 prices) by 2016 – an amount approximately equal to a third of the average household energy bill in that year.

Chart showing downward revisions to UK nominal GDP growth between 2011 and 2016

These revisions are summarised by the ONS here, and their sources are discussed here. The bulk of the revisions are due to the contribution of the insurance industry to GDP being revised down by the use of Solvency II regulatory data, as well as improvements to the way pension schemes are measured. In addition, and of particular relevance for the current exercise, part of the revisions are due to the ONS, “bringing through a package of sources and methods changes that improve the international comparability of the UK gross domestic product (GDP) estimates.” 

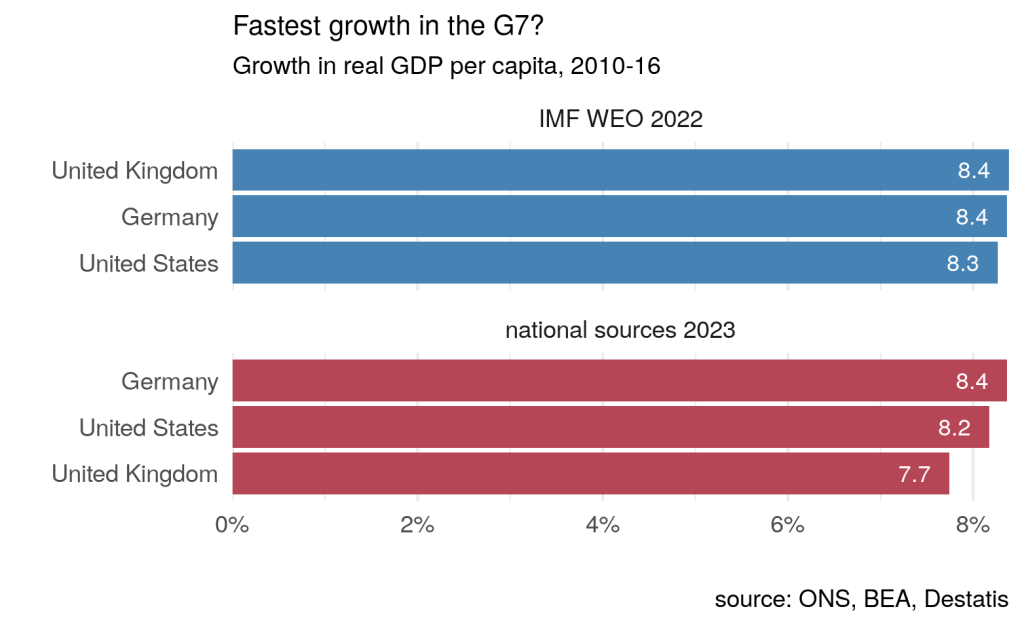
These revisions make a material difference to UK GDP, as well as its international ranking. On the basis of the latest official figures taken directly from national statistical agencies, real UK per capita growth of 7.7% during the austerity period compares with 8.4% for Germany and 8.2% for the US.

Chart comparing growth rates in US, UK and Germany between 2010 and 2016.

So, based on the most recent data, the UK did not have the fastest growth in GDP per capita between 2010 and 2016. 

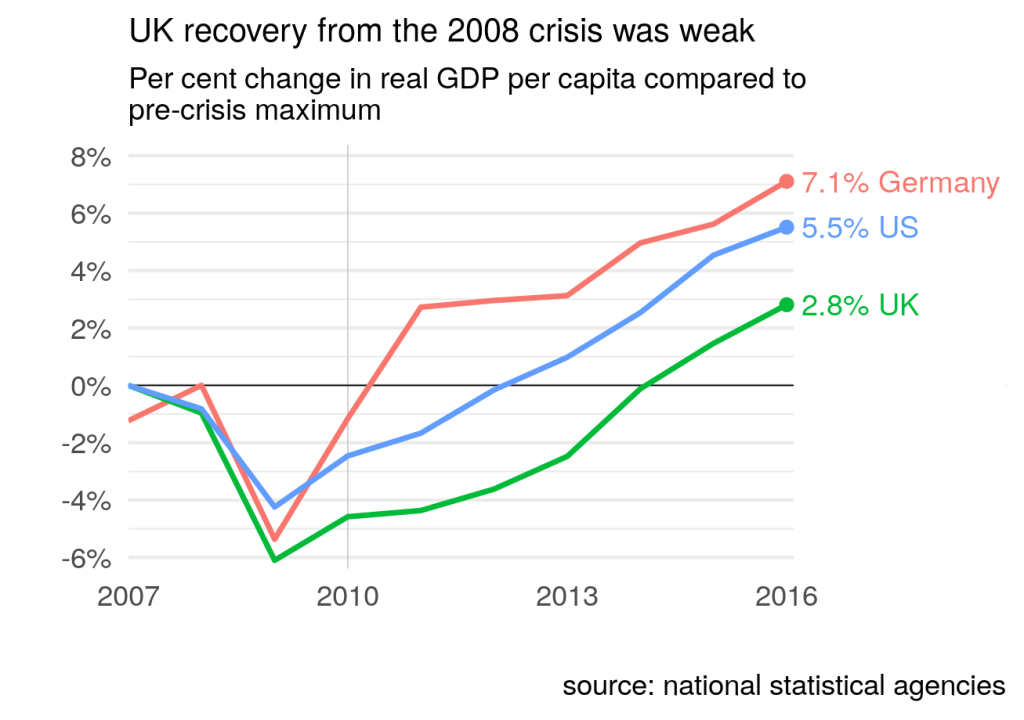
Aside from this, as others have noted, focusing narrowly on the 2010-2016 period is potentially misleading. When austerity was implemented, the UK was in the process of recovering from the 2008 recession. It is likely that there was substantial spare capacity which, under strong demand conditions, could have been quickly reabsorbed into economic activity. If we start our comparison at the pre-crisis peak (2007 for the UK and US, 2008 for Germany), rather than 2010, the divergence is much greater: by 2016, real UK GDP per capita had increased by 2.8% on its pre-crisis level, compared with 5.5% for the US and 7.1% for Germany. Much of UK growth during between 2010 and 2016 was recovering losses from the recession: GDP per capita did not reach pre-2008 levels until 2014, compared to 2011 for Germany and 2012 for the US.

As Chris Giles notes, “Most economists now accept that the sharp reductions in public spending between 2010 and 2015 delayed the recovery from the financial crisis”. Comparing outcomes with pre-crisis levels is not, therefore, “baseline bingo” as claimed by Rupert Harrison. These outcomes are hard to square with Harrison’s claim that this is “what catch up looks like”.

Chart showing real GDP per capita between 2007 and 2016 in US, UK and Germany

These data revisions highlight the dangers in drawing strong conclusions – particularly about politically loaded topics – from small differences in data that are subject to measurement error and revision. It is inevitable that an FT article claiming that UK growth per head was highest in the G7 during the main austerity years will be used as justification for austerity policies. But, on the basis of the most recent and accurate data available, the claim is false. UK GDP growth was relatively strong by international standards (and may yet be revised back to the top of the table) but this statement ought to be placed in its proper context, using a variety of data sources and an understanding of their strengths and weaknesses.

Nominal GDP (YBHA)Real GDP (ABMI)
Year2021 Blue Book2022 Blue Book2021 Blue Book2022 Blue BookIMF 2022 WEO
20101,612,1951,612,3811,884,5151,876,0581,884,515
20111,669,5091,664,2111,911,9831,896,0871,911,983
20121,721,3551,713,2411,940,0871,923,5511,940,087
20131,793,1551,782,2961,976,7551,958,5571,976,755
20141,876,1621,862,8272,035,8832,021,2252,035,883
20151,935,2121,920,9982,089,2762,069,5952,089,276
20162,016,6381,999,4612,136,5662,114,4062,136,566

Data are in millions of pounds (2019 pounds for the real data). Data downloaded from ONS and IMF websites on 20th March 2023. Note that the 2022 Blue Book dataset was only published on the 31st October 2022, too late for inclusion in the IMF’s October 2022 World Economic Outlook. The revisions were initially introduced (and reported on) in August 2022, the quarter before the Blue Book publication.

Pension funds and liquidity spirals

Bruno Bonizzi and Jennifer Churchill

Falling prices in UK government bond (aka gilts) markets yesterday forced the Bank of England to intervene: “a material risk to financial stability” led the Bank to “carry out temporary purchases of long-dated UK government bonds” and to postpone the beginning of Quantitative Tapering, i.e. the sale of bond holdings accumulated over the past decade.

Falls in gilt prices are caused by both global factors – the strong dollar and rising global interest rates – and the large unfunded tax cuts announced in Kwasi Kwarteng’s budget. The most immediate worry is the risk of pension funds “falling over”. How do increasing bond yields pose a problem for pension funds?

Pension funds are widely assumed to function as large passive “containers” of long-term assets which engage in little short-term activity. This is incorrect: pension funds, especially large and mature ones, are sophisticated investors that use leverage and derivatives to achieve their financial objectives.

One such objective, for Defined Benefits (DB) pension funds (that still hold most UK pension fund assets), is best captured by the rise of the Liability Driven Investment (LDI) paradigm. According to LDI, the ultimate goal of pension funds is not the maximisation of returns per se, but performance against the commitments originating from pension liabilities. The key objective of LDI is the minimisation and stabilisation of the so-called “funding deficit”, the difference between the market value of assets and the discounted value of the future pensions to be paid (liabilities).

To achieve the stabilisation of the “funding deficit”, pension funds use a dedicated protection or liability-matching portfolio. This involves strategies that makes the value of assets move in the same direction as the valuation of liabilities. The most important influence on the funding deficit is movements in interest rates: if rates fall, the value of liabilities rises because bond yields are used as discount rates. But if pension funds invest in bonds with similar duration (i.e. sensitivity to interest rate changes) to their liabilities, their assets will also increase by a similar amount, leaving the funding deficit unchanged.

As well as bonds, these strategies also use interest rate swaps, which act in a similar way: pension funds pay a variable rate (e.g. the LIBOR or its recent replacement SONIA) in exchange for a fixed interest payment (the swap rate). By so doing they hedge against interest rate changes. Another LDI strategy is to use repos: pension funds can use their gilts to borrow in the repo market, and then buy more gilts, effectively doubling their exposure to gilts, and thus the degree of interest rate hedging.

The advantage of using repos and derivatives is that it frees up space to invest in other assets. Rather than fully investing their portfolio in bonds, pension funds typically hold a growth portfolio which is invested in all sorts of higher-risk assets, with the objective of increasing returns. This too can make use of derivatives, especially to hedge foreign currency risk. Data from the the ONS Financial Survey of Pension Schemes shows that interest rate swaps and foreign exchange forwards account for almost the totality of derivatives held by pension funds, and these sum (in gross terms) to over 10% of the value of their assets. And while LDI is only relevant to DB pension funds with debt-like liabilitiesall pension funds hedge their overseas assets.

These strategies all require collateral, often short-term bonds. A decline in the market value of collateral or the value of the derivative contracts can lead to margin calls on repo or on interest rate swaps, as explained by Toby Nangle. Similarly, if the value of the sterling falls, pension funds might face margin calls on their foreign exchange derivative positions.

This means that pressure in the short-term bond market can spill over into the market for long-term bonds. To meet margin calls, pension funds can be forced at the extreme to sell growth assets (such as equity, or long-term bonds) to raise the required liquidity to meet margin calls. This is what was seen in the wake of the budget, with pension fund managers reportedly “throwing the kitchen sink to meet margin calls”. If margin calls are not met then collateral could be seized and liquidated, further adding to the downward pressure on asset prices.

This is how we find ourselves in liquidity spiral territory – a situation of severe financial instability, as markets become one-sided, depressing asset prices and potentially provoking more margin calls. The risk of such instability lay behind the decision by the BoE to intervene.

More trouble could be on the horizon: similar liquidity spirals could originate in other derivative markets, such as foreign exchange derivatives as the Pound keeps depreciating against the dollar, or other financial institutions. The possibility of a broader “dash for cash”, requiring more BoE intervention, is still very much on the cards.

Do economists need to talk about consumption?

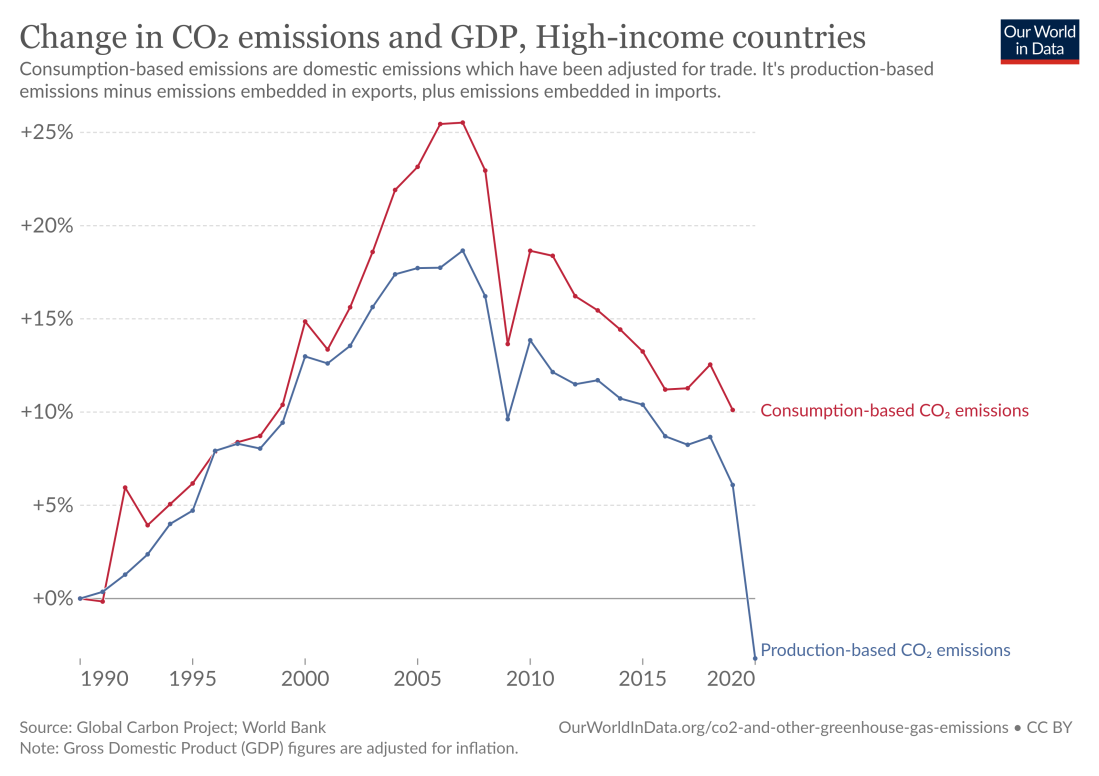
Chart showing measures of CO2 emissions for high-income countries

This post was originally published here, as part of a series titled Demanding change by changing demand produced by environmental charity Global Action Plan. Some similar themes are explored in more technical detail in the context of lower- and middle- income countries in a recent working paper for the ILO, co-authored with Adam Aboobaker.

For much of the last thirty years or so, progressive economists have argued that macroeconomic policy is too tight. In simpler terms, this means that some combination of higher government spending, lower taxation, and lower interest rates will lead to more jobs and higher incomes.

Such arguments are sometimes presented as part of advocacy for initiatives responding to the environmental crisis, such as the Green New Deal. For the most part, however, the environmental implications of higher near-term economic activity in rich countries do not attract much attention – it is taken as given that higher economic activity, as measured by gross domestic product (GDP), is unequivocally positive.

The current situation of high inflation, driven by energy shortages, war and climate change, serves as a sharp reminder that there is something missing in analysis which sees higher growth as an entirely free lunch. Almost all economic activity depletes scarce physical resources and generates carbon emissions. Higher employment usually comes at the cost of higher emissions. Furthermore, it is possible that we are now also reaching the end of the historic period in which physical resources were usually immediately available – so that economic activity could quickly rise in response to higher overall spending. The era of the Keynesian free lunch may be ending, replaced by a regime characterised by recurring inflationary episodes.

This puts progressive economists, like myself, who believe that the economies of rich countries are predominantly demand driven – meaning that higher overall spending means more jobs and higher incomes – in an uncomfortable position.

This view relies partly on the idea of the “multiplier”. This is the claim, which is well supported by empirical evidence, that every pound of new spending in the economy will generate additional income and spending over and above the initial pound spent. The mechanism works, to a large extent, by stimulating consumption spending: if a new government investment project is initiated – to provide additional green energy, for example – the money spent on the project – on wages, transport and materials – will be received by individuals and businesses as income. Some of this additional income will be spent on consumption, generating a second round of additional new incomes.

Similarly, the argument that redistribution from those on higher incomes to those on lower incomes is good for growth relies on the fact that those on lower incomes spend a greater proportion of their incomes on consumption goods – redistribution from rich to poor thus raises total consumption expenditure and economic activity.

How are progressive economists to respond to the now inescapable fact that current resource use greatly exceeds planetary limits, and “decoupling” – the trend for energy and resource use per dollar of spending to fall as GDP rises – will not be sufficient to stay within planetary boundaries if steady GDP growth continues?

There is no single answer to this question – the appropriate response will require action on many fronts simultaneously. However, economists are beginning to consider whether we need to introduce constraints on consumption, at least for those on higher incomes in rich countries, as part of the solution. Rather than relying only on voluntary consumer choice and natural shifts in consumption patterns – such as the trend towards lower consumption of meat in some rich countries – it may be that state intervention is required to influence both overall levels of consumption and its distribution.

There are two main arguments in favour of constraining consumption. The first is straightforward: all consumption, whether of food, transport, clothing or shelter, involves carbon emissions and resource depletion. Reduced consumption growth should translate directly into lower emissions growth.

The other relates to the need to reallocate current resources, including labour, towards the investment needed to fundamentally reshape our economic systems. Lower consumption means fewer people working in industries which provide for consumption spending, and fewer raw materials devoted to the production of consumption goods. This frees up resources for green investment: people and materials can be re-deployed towards the investment projects which are urgently needed.

This raises some thorny questions: what policy tools can be used to shift the composition and scale of consumption? Which groups should face incentives – or compulsion – to reduce consumption and what form should these measures take? How will voluntary shifts in consumption interact with more direct measures to reduce consumption? And crucially, how can jobs and incomes be protected without relying on consumption as a key driver of macroeconomic dynamism?

Much of this comes down to issues of distribution. Statistics on poverty make clear that large numbers of people in rich nations are unable to consume sufficient basic necessities. Basic justice dictates that the average incomes and consumption of those in lower income countries be allowed to catch up with those of richer countries. The need for redistribution of income within countries, and income catch-up across countries is undeniable – yet such redistribution, if it were to occur without other changes, will lead to increased overall consumption and emissions.

It is therefore hard to avoid the conclusion that taxation and regulation will be required to limit some part of the energy-intensive consumption of those on higher incomes in rich countries, particularly consumption which can be considered “luxury” consumption.

One plausible response to such suggestions is to claim that voluntary shifts in the kinds of things produced and consumed will naturally lead to reduced emissions, even while “consumption”, as measured by the national accounts, continues to grow. This kind of voluntary behavioural and consumption change – buying fewer cheap clothes, holidaying by rail rather than plane, switching to electric cars – will have a part to play in the transition to a low carbon economy, alongside reorientation from goods consumption to a more services-driven “foundational” economy. It is unlikely, however, that such changes will be sufficient.

The politics of consumption constraints are daunting. Managing competing distributional claims in the face of opposition from increasingly concentrated wealth and power is hard enough when the overall pie is growing. As we move towards a world of potential genuine scarcity, the politics of redistribution will become even more malign. This only emphasises the importance of getting the economics right.

Any successful response to the climate crisis will inevitably involve action and change at all levels – from local organising and “organic” shifts in consumption to reform of financial systems and action to tame corporate power and concentrated wealth. Constraints on the consumption of the relatively well off should be part of such a response. A debate about the economics and politics of these constraints is overdue.

Fiscal silly season

We are entering fiscal silly season. As the budget approaches, we should brace for impact with breathless reporting of context-free statistics about inflation, interest rates and government debt.

The story is likely to go something like this. Inflation is rising. This raises costs on government debt because some of it (index-linked bonds) pays an interest rate linked to inflation. Costs associated with quantitative easing (QE) will also increase because QE is financed by central bank reserves which pay Bank Rate (the Bank of England’s policy rate of interest). Since inflation is rising the Bank will have to raise interest rates to control it. This will increase the financing costs of QE and the cost of issuing new debt for the Treasury.

The conclusion — sometimes implied, sometimes explicit — is usually some version of “the situation is unsustainable therefore the government will have to make cuts”.

While each part of the story is technically correct in isolation, the overall narrative — debt is out of control and the situation is going to get worse because of inflation — doesn’t stand up to scrutiny.

These stories are rarely presented with sufficient context. Instead, journalists tend to rely on statistical soundbites such as “public debt is the highest since … ”. This is rarely if ever accompanied by the fact that debt/GDP is a fairly meaningless number.

The problems associated with government debt essentially boil down to the fact that debt involves redistribution. In the case of the government this means redistribution in the form of transfers from tax payers to bond holders. This is politically difficult. (This is also why “but currency issuer …” responses to these issues are largely beside the point — the problems of debt management are ultimately political not technical).

The ratio of debt to GDP tells us very little about the current political difficulties arising from debt servicing. Instead, the relevant magnitudes are total interest payments and tax revenues.

Total interest payments are equal to the debt stock multiplied by the effective interest rate on government debt. Focusing on the debt stock in isolation is thus equivalent to representing the area of a rectangle by the length of one side.

A better indicator of the risks associated with public debt is the ratio of government interest payments to tax revenues, as plotted in the figure below.

source: macroflow

Interest payments on government debt have indeed risen recently. A spike in June triggered media articles about the highest interest payments on record. In context, such statistics are shown to be meaningless. Interest payment have risen to around 6% of taxation over a four quarter period, compared with all-time lows of about 5.3%. (Calculated on a 12 monthly basis this rises to around 6.5%). It is hard to see signs that the sky is falling.

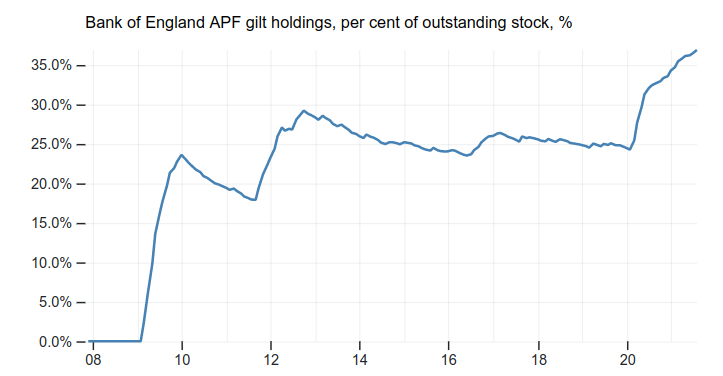
In fact, this indicator overstates current interest costs. This is because much of the interest paid by the Treasury is paid to the Bank of England which holds a substantial chunk (currently around 37%) of UK government debt as a result of QE (see chart below). Most of this interest is returned directly to the Treasury. Since the start of QE, this has saved the Treasury over £100bn in interest costs.

source: macroflow

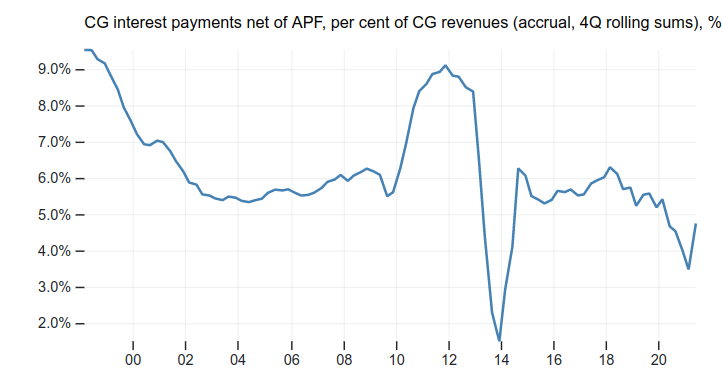
Adjusting for this reduction in interest payments produces the figure below: net interest payments sum to around 4.7% of tax revenues over the last four quarters (or 5.2% on a rolling 12 monthly basis).

source: macroflow

What of the dangers ahead? It is true that if inflation rises, then interest costs will rise, all else equal. But the scale of these rises is not predetermined, and will be affected by policy.

First, persistent inflation is far from a certainty. If if inflation does persist in the short term, the Bank does not need to raise interest rates. Hikes in response to price pressures due to pandemic reopening and supply side bottlenecks will do more harm than good — instead the Bank should wait until the economic recovery is clearly underway. In this context, interest rate increases would likely be a good sign, and would be offset by rising tax revenues. Further, the Bank could introduce a “tiered reserve” system which would serve to hold down the rate paid on a substantial proportion of outstanding debt. Short term and index-linked debt can be rolled over at longer maturities, delaying the point at which higher rates would feed into higher interest payments.

In summary, simple claims such as “a one percentage point rise in interest rates and inflation could cost the Treasury about £25bn a year” are not useful without context and explanation of the long list of assumptions required to produce such a figure. The policy conclusions derived from such claims should be taken with a large pinch of salt.

Season’s Greetings and enjoy the festive period!

Loanable funds is not helping

Noah Smith has a Christmas post in which he intervenes in the debate over whether $600 government cheques should be given to rich people or poor people. This is the latest iteration of the age-old debate that stems from the dubious argument that income inequality is good because rich people use resources efficiently and poor people waste them. Noah correctly concludes that this argument is wrong and that cheques should be sent to those on lower incomes. But his argument contains several mistakes.

National Saving

Noah starts by discussing whether the rich or poor are more likely to save their $600 cheque, noting that although the rich have a higher propensity to save than the poor, the effect on “national saving” of windfall gains like a one-off cheque may be hard to predict: “if you want to increase national saving, you might want to give the $600 to Tiny Tim instead of to Scrooge!”

Noah’s assumption, at this point in the argument, is that unspent government cheques will increase “national saving”. Is this plausible?

The official definition of “national saving” is total income, Y, less total consumption expenditure, C, (including government consumption). Since “saving” for each sector is sector income less sector consumption, “national saving” is also equal to private saving plus public saving. Manipulation of accounting definitions demonstrates that S = I + CA, where S is national saving, I is total investment (private and public) and CA is the current account surplus. For a closed economy, CA = 0 and S = I. For “national saving” to increase, either I or CA must increase.

Why would members of the public — rich or poor — depositing government cheques at banks increase national saving?

If the cheques are bond-financed, then private sector financial investors have handed over deposits in return for government bonds, while households have accepted deposits. The overall effect is an increase in bond holdings by the private sector, and a redistribution of private deposit holdings. Since private sector income has increased but consumption has not, private sector saving has increased.

But public sector saving has decreased by an equal amount. National saving is unchanged — as is total income. (The same is true for tax-financed cheques.)

Loanable funds

Noah then poses the question “do we really want to increase national saving?”

On a charitable reading, we can assume that, by “national saving”, Noah means “private sector saving”, and his question should be read accordingly.

To answer the question, Noah uses the loanable funds model. Before going on, we need a brief recap on why this model is incoherent, at least when used without care.

As already noted, S = Y – C = I + CA: “National saving” is just another way of saying “investment plus the current account”. There is no such thing as a “supply of savings”: households can choose to consume or not consume. They cannot decide on the size of S, because it equals Y – C. Households choose C but not Y, therefore they don’t choose S. A macro model which has “supply of saving” as an independent aggregate variable is incorrectly specified.

Noah uses this model to consider what happens when the “supply of saving” increases (which he apparently takes as equivalent to the “supply of” what he calls national saving).

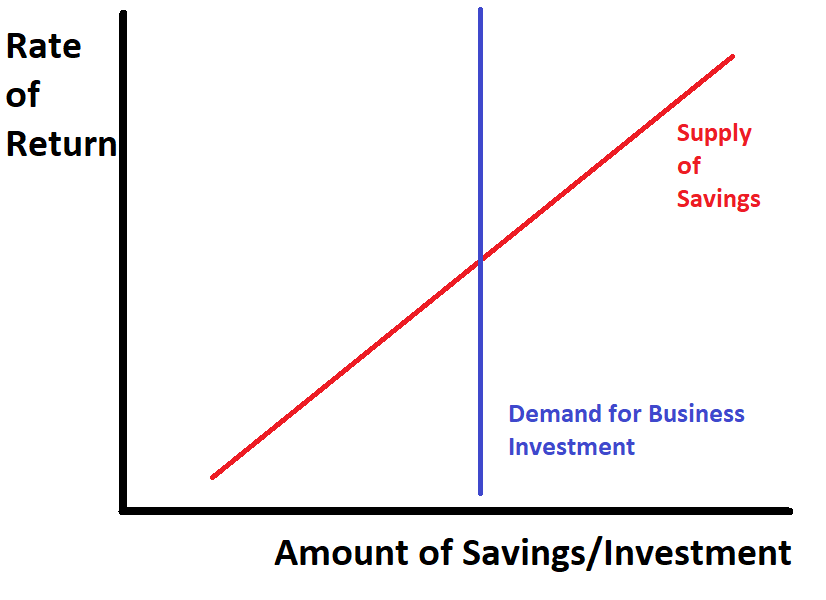
He starts by noting that the usual configuration is such that an increase in the “supply of saving” causes “interest rates or stock returns or whatever” to fall and this in turn raises business investment. He then adjusts the model by asserting, “OK, suppose that the amount of business investment just doesn’t depend much on the rate of return”. (By “rate of return” he means “interest rates or stock returns or whatever”, i.e. the rate paid on loans by business, not the rate of profit on business investment.) This gives a diagram like so:

Now, here comes the punchline:

OK, now suppose that in this sort of world, you give someone $600 and they stick it in the bank. That increases the supply of savings. But it doesn’t do anything to the demand for business investment. Businesses invest the same amount. And the rate of return just goes down … in fact total saving doesn’t even go up!

What’s going on here? The supply of savings has increased yet total saving doesn’t change? To understand what Noah thinks he’s saying, let’s switch to apples briefly. Imagine the same supply-demand diagram as above with a vertical (inelastic) demand curve but this time for apples.

This model says that, assuming the quantity of apples consumed is fixed, if the cost of production of apples decreases (because that’s what the supply curve represents, at least in a competitive market), then the price of apples falls. A similar outcome arises if, instead of the cost of production falling, a magician appears, waves a wand, and a stack of extra apples magically appear all harvested and ready for market. At the marketplace, if nobody knows about the wizard, it just looks like the price of apples has fallen.

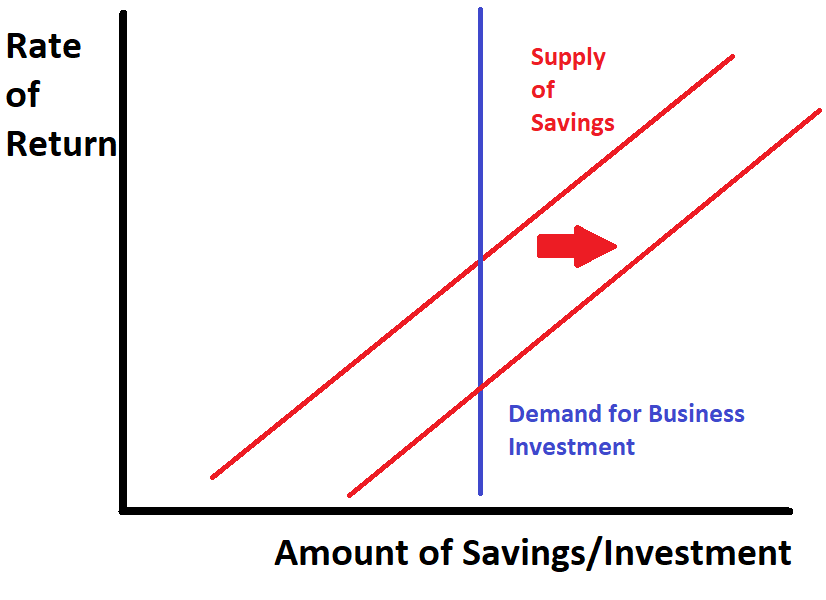
This is what Noah is doing with the “increase in supply of savings (apples)” arising from the $600 cheques (magic apples): since the “demand for savings” (apples) is fixed, apple sales (business investment/”national savings”) won’t change, but the price (“the rate of return on stocks or whatever”) falls. On the diagram, it looks like this:

This is incoherent in its own terms because, as already noted, a “supply of savings” doesn’t exist in the same way that a supply of apples does: apples are not one number minus another number.

But even putting this non-trivial issue aside, There is a another problem.

Where did the apples go?

Remember that the “supply of savings” has increased in the sense that the price per unit has fallen. But the actual quantity of “savings” is unchanged, according to Noah.

In apple world, the way this works is that when the magic apples appear, the orchard people, understanding the inelastic demand curve of the marketplace, save themselves some effort, harvest less apples, but take the right amount to the marketplace.

How does it work for the “supply of savings?” Don’t worry, Noah has an answer!

You give the $600 to one person, they stick it in the bank or in the markets, that lowers interest rates or stock returns or whatever, and then other people save $600 less as a result. No change.

Pretty neat. Every time someone banks a $600 cheque, another person responds by spending exactly $600 on consumption! In the aggregate, Noah tells us, every dollar is spent! It’s actually impossible for the private sector to save their cheques!

Conclusion

This kind of incoherence is where you end up when you read results from pairs of lines that do not represent the thing that you are trying to understand. The conclusion that total consumption expenditure increases by an amount exactly equal to the total value of the cheques arises as the result of a sequence of ill-defined concepts and inappropriate assumptions, all bolted together without much thought.

In reality, what will happen is the following. Some cheques will be saved, some will be spent on consumption. Those that are saved will have no effect on national saving and probably little effect on the rate of interest, although they might nudge asset prices up a bit. Higher consumption will lead to higher national income, employment and imports. National income will probably rise by more than the amount spent on consumption because of the multiplier. “National saving” is a residual — income less consumption — and is a priori indeterminate. None of this requires us to go anywhere near a loanable funds model.

Loose use of terminology and hand-waving at poorly-defined graphical models does not constitute macroeconomic analysis.

How pension funds shape financialisation in emerging economies in Colombia and Peru

Guest post: Bruno Bonizzi, Jennifer Churchill and Diego Guevara

In early spring 2020 emerging economies (EEs) were hit by the largest ever episode of portfolio outflows. Stock and bonds were sold as investors fled to safer investments in Europe and the United States, showing once again the fragile nature of EEs’ financial integration. To overcome this problem, one suggested solution is to allow for a larger base of domestic institutional investors, such as pension funds, which can stabilise financial markets. While having a large institutional investor base can be a source of demand for domestic financial securities, it is important to review the evidence from the experience of those EEs where pension funds have existed for more than two decades.

As we show in our forthcoming article, the experience of Colombia and Peru can be instructive. Their pension system, while maintaining a significant parallel public Pay-As-You-Go structure, has a sizeable funded private component with assets that have grown to over 20% of GDP. These were established as part of the Washington Consensus reforms in the 1990s, following the prior example of Chile.

However, more than two decades since the creation of private pension funds, capital markets in the two countries, as in the rest of Latin America, remain small and underdeveloped. It is perhaps for this reason that the experience of pension funds in Latin America remains under-researched by financialisation scholarship. However, recent literature has put forward the idea that financialisation patterns, while having common tendencies, can present “variegated” forms. Pension funds play a role in this process by exerting an important role in shaping the demand for financial assets, even if this does not occur, as in typical “Liberal Market Economies” by fuelling domestic capital markets.

Some key characteristics of Colombia and Peru’s political economy have acted as the distinct determinants of pension fund demand for assets, shaping a specific form of financialisation. Firstly, pension funds in these countries reflect the characteristics of Hierarchical Market Economies, the Latin American variety of capitalism. Workers and unions have very limited control over how pension fund assets are invested, as pension funds are provided by private companies as pure individual retirement accounts. Investment policy is therefore heavily shaped by the interest of the financial industry, which was also key in promoting their establishment and in shaping their regulation since.

But next to these considerations, pension fund asset demand in Colombia and Peru has been structurally constrained by the limited by limited effective space in domestic capital markets. These two countries have a highly “extraverted” growth regime, where commodity exports play a key role in determining aggregate demand. As a result of the 2000-2014 commodity price boom, companies had substantial financing coming from export proceeds and foreign direct investment, therefore limiting their issuance of securities in domestic capital markets. Governments too limited their net borrowing during this period, thanks to booming revenues and limited increases in public spending. Additionally, the countries have attracted considerable interest by foreign financial investors, whose weight in domestic bond and stock markets increased. These characteristics reflect the status of Colombia and Peru of as subordinate emerging economies in global financial markets.

Pension funds in Colombia and Peru have looked for other investments. Supported once again by the domestic and international financial industry, these have been found in “alternative assets”, most typically private equity, infrastructure and real-estate funds, as well as in foreign investment, which now account for more than a third and more than 40% of total assets in Colombia and Peru respectively. The latter have been important in stimulating a derivative market to hedge foreign currency positions, mostly vis-á-vis US dollars.

Therefore, pension funds have been important in shaping the financialisation trajectory in these two countries, despite the limited development of domestic capital markets. This can serve as an important lesson to calls for the promotion of private pensions to stabilise capital markets. In emerging economies subject to subordinate forms of economic and financial integration, and where the interests represented are those of a highly concentrated financial industry, pension funds may fail to act as catalysts for deep, liquid and stable domestic capital markets. They may instead contribute to finance privatised forms of infrastructure and real estate and reinforce the hierarchies of global finance.

Developing and emerging countries need capital controls to prevent financial catastrophe

A shorter version of this letter was published in the Financial Times on 25 March 2020.

All countries currently face the unprecedented threat of a simultaneous and global health crisis, economic recession and financial meltdown. But unlike rich nations, emerging and developing countries  (DECs) lack the policy autonomy needed to confront these crises. The global currency hierarchy places DECs in the periphery of global financial markets, exposing them to sudden stops caused by triggers such as the COVID-19 crisis. The US Federal Reserve announced it would lend up to USD 60bn to the central banks of Mexico, Brazil, South Korea and Singapore. But this is not enough. Immediate capital controls, coordinated by the IMF, are needed to prevent financial disaster.

In a global financial crisis, there is a rush to hold liquid assets denominated in safe currencies, especially US dollars. This enables rich countries to respond to crises with the necessary fiscal and monetary tools. The opposite is true for DECs. Since the outbreak of the COVID-19 crisis, international investors have withdrawn large sums from DEC assets, leading to dramatic currency depreciation, especially for those exposed to falling commodity prices.

Over the past decade, ample global liquidity driven by rich country central banks, alongside sustained demand for liquid assets, has led to enormous flows of credit and equity investment into DECs, where bond and stock markets grew from about 15 trillion to 33 trillion US dollars between 2008 and 2019. ‘Frontier economies’ and DECs corporations have issued substantial volumes of foreign currency debt. With G20 encouragement, DECs opened their domestic currency bond markets to international investors. In what has been termed the second phase of global liquidity, new financial instruments and institutions, such as international funds and exchange-traded funds (ETFs), have enabled easy global trading of DECs assets, cementing the illusion of liquidity.

DECs are now confronted with a sudden stop as global liquidity conditions tighten and investors flee from risk: exposure to DECs remains a high-risk/high-return strategy, to be liquidated in times of crisis. In consequence, DECs face severe macroeconomic adjustment at precisely the moment when all available tools should be used to counter the public health crisis presented by COVID-19: some countries may be forced to tighten monetary policy in an attempt to retain access to the US dollar, while fiscal action may be constrained by fear of losing access to global markets. Foreign exchange reserves are unlikely to provide a sufficient buffer in all countries. This would have profound consequences for the global economy: DECs, both in the G20 and beyond, are now far more important for global growth and markets than even a decade ago. The failure of a large sovereign or quasi-sovereign borrower could trigger significant contagion.

There is an urgent need for action to prevent this crisis reaching catastrophic proportions in DECs. Despite long-standing calls for action, there is still no international lender of last resort. The only instruments currently available are IMF lending and foreign exchange (FX) swap lines between central banks. IMF loans typically impose fiscal tightening, which would be disastrous under current conditions. The US Federal Reserve stands ready to provide US dollars to a handful of major central banks: among DECs, only Mexico can access Fed and US Treasury swap lines under NAFTA provisions, and South Korea and Brazil have just had their arrangements re-opened. But these ad-hoc arrangements exclude a large proportion of DECs’ need for dollar liquidity.

We call for decisive action to constrain the financial flows currently transmitting the crisis to EMs. Capital controls should be introduced to curtail the surge in outflows, to reduce illiquidity driven by sell-offs in DECs’ markets, and to arrest declines in currency and asset prices. Implementation should be coordinated by the IMF to avoid stigma and prevent contagion. FX swap lines should be extended to include more DECs, in order to ensure access to US dollars. Finally, we concur with recent calls for greater provision of liquidity by the IMF using special drawing rights (SDRs) but this must take place without the imposition of pro-cyclical fiscal adjustment.

The unfolding crisis is one of the most serious in economic history. We must ensure that governments can do everything possible to protect their citizens. In our globally integrated economy, coordinated action is needed to minimise the externally-imposed constraints on developing and emerging countries as they face the triple threat of pandemic, recession and financial crisis.

Organising Signatories

Nelson Barbosa, Sao Paolo School of Economics

Richard Kozul-Wright, UNCTAD

Kevin Gallagher, Boston University

Jayati Ghosh, Jawaharlal Nehru University

Stephany Griffith-Jones, Columbia University

Adam Tooze, Columbia University

Bruno Bonizzi, University of Hertfordshire

Daniela Gabor, UWE Bristol

Annina Kaltenbrunner, University of Leeds

Jo Michell, UWE Bristol

Jeff Powell, University of Greenwich

Signatories

Adam Aboobaker, University of Massachusetts Amherst

Kuat Akizhanov, University of Birmingham and University of Bath

Siobhán Airey, University College Dublin

Ilias Alami, Maastricht University

Alejandro Alvarez, UNAM, México

Donatella Alessandrini, University of Kent

Jeffrey Althouse, University of Sorbonne Paris Nord

Carolina Alves, Girton College – University of Cambridge

Paul Anand, Open University and CPNSS London School of Economics

Phil Armstrong, University of Southampton Solent and York College

Paul Auerbach, Kingston University

Basani Baloyi, South Africa 

Frauke Banse, University of Kassel, Germany

Benoît Barthelmess, Le Club Européen

Pritish Behuria, University of Manchester

Kinnari Bhatt, Erasmus University Rotterdam

Samuele Bibi, Goldsmiths University

Joerg Bibow, Skidmore College

Pablo Bortz, National University of San Martín

Alberto Botta, University of Greenwich

Benjamin Braun, Institute for Advanced Study, Princeton

Louison Cahen-Fourot, Vienna University of Economics and Business

Jimena Castillo, University of Leeds, UK

Eugenio Caverzasi, Università degli Studi dell’Insubria

Jennifer Churchill, Kingston University, London

M Kerem Coban, GLODEM, Koc University, Turkey

Andrea Coveri, University of Urbino, Italy

Moritz Cruz, UNAM, Mexico

Florence Dafe, HfP/TUM School of Governance, Munich

Yannis Dafermos, SOAS University of London

Daria Davitti, Lund University, Sweden

Adam Dixon, Maastricht University

Cédric Durand, Université Sorbonne Paris Nord

Chandni Dwarkasing, University of Siena, Italy

Gary Dymski, University of Leeds

Ilhan Dögüs, University of Rostock, Germany

Carlo D’Ippoliti, Sapienza University of Rome

Dirk Ehnts, Technical University of Chemnitz

Luis Eslava, Kent Law School, University of Kent

Trevor Evans, Berlin School of Economics and Law

Andreas Exner, University of Graz

Karina Patricio Ferreira Lima, Durham University

José Bruno Fevereiro, The Open University Business School

Andrew M. Fischer, Erasmus University Rotterdam

Giorgos Galanis, Goldsmiths, University of London

Santiago José Gahn, Università degli studi Roma Tre

Jorge Garcia-Arias, University of Leon, Spain and SOAS, University of London

Alicia Girón – UNAM-MEXICO

Thomas Goda, Universidad EAFIT, Colombia

Antoine Godin, University Sorbonne Paris Nord

Gabriel Gómez, UNAM, México

Jesse Griffiths, Overseas Development Institute

Diego Guevara, National University of Colombia

Alexander Guschanski, University of Greenwich

Sarah Hall, University of Nottingham

James Harrison, Prof, University of Warwick

Nicolas Hernan Zeolla, National University of San Martin, Argentina

Hansjörg Herr, Berlin School of Economics and Law

Elena Hofferberth, University of Leeds

Jens Holscher, Bournemouth University

Peter Howard-Jones, Bournemouth University

Bruno Höfig, SOAS, University of London

Roberto Iacono, Norwegian University of Science and Technology

Stefanos Ioannou, University of Oxford

Andrew Jackson, University of of Surrey 

Juvaria Jafri, City University of London

Frederico G. Jayme, Jr, Federal University of Minas Gerais, Brazil

Emily Jones, University of Oxford

Ewa Karwowski, University of Hertfordshire

Y.K. Kim, University of Massachusetts Boston

Stephen Kinsella, University of Limerick

Kai Koddenbrock, University of Frankfurt

George Krimpas, University of Athens

Sophia Kuehnlenz, Manchester Metropolitan University

Ingrid Harvold Kvangraven, University of York

Annamaria La Chimia, University of Nottingham

Dany Lang, Université Sorbonne Paris Nord

Jean Langlois, Le Club Européen

Christina Laskaridis, SOAS, University of London

Lyla Latif, University of Nairobi

Thibault Laurentjoye, École des Hautes Études en Sciences Sociales (EHESS), Paris

Dominik A. Leusder, London School of Economics

Noemi Levy-Orlik, UNAM, Mexico

Gilberto Libanio, Federal University of Minas Gerais, Brazil

Duncan Lindo, Vrije Universiteit Brussel

Lorena Lombardozzi, Open University

Anne Löscher, University of Siegen, Germany; University of Leeds

Birgit Mahnkopf, Prof.i.R., Berlin School of Economy and Law

Pedro Mendes Loureiro, University of Cambridge

Victor Isidro Luna, UNAM

Jonathan Marie, Université Sorbonne Paris Nord

Norberto Montani Martins, Federal University of Rio de Janeiro, Brazil

Olivia Bullio Mattos, St. Francis College, New York, USA

Andrew Mearman, University of Leeds

Monika Meireles, UNAM

Thorvald Grung Moe, Levy Economics Institute

Lumkile Mondi, University of the Witwatersrand, South Africa

Thanti Mthanti, University of the Witwatersrand, South Africa

Susan Newman, Open University

Howard Nicholas, International Institute of Social Studies, Erasmus University Rotterdam

Maria Nikolaidi, University of Greenwich

Patricia Northover, University of the West Indies, Jamaica

Cem Oyvat, University of Greenwich

Oktay Özden, Marmara University, Turkey

Vishnu Padayachee, University of the Witwatersrand 

Rafael Palazzi, PUC-Rio, Brazil

José Gabriel Palma, Cambridge University and USACH

Marco Veronese Passarella, University of Leeds

Jonathan Perraton, University of Sheffield

Nicolás M. Perrone, Universidad Andres Bello, Viña del Mar

Keston K. Perry, UWE Bristol

Mate Pesti, UWE Bristol

Karl Petrick, Western New England University

Christos Pierros, University of Athens

Leonhard Plank, TU Wien

Jose Pérez-Montiel, University of the Balearic Islands, Spain

Hao Qi, Renmin University of China

Mzukisi Qobo, Wits Business School, University of Witwarsrand

Joel Rabinovich, University of Leeds

Dubravko Radosevic, University of Zagreb

Miriam Rehm, University of Duisburg-Essen

Marco Flávio da Cunha Resende, Federal University of Minas Gerais, Brazil

Lena Rethel, University of Warwick

Sergio Rossi, C University of Fribourg, Switzerland

Maria Jose Romero, Eurodad

Roy Rotheim, Skidmore College

Josh Ryan-Collins, UCL Institute for Innovation and Public Purpose

Alfredo Saad Filho, King’s College London

Lino Sau, University of Torino, Italy

Malcolm Sawyer. Emeritus Professor of Economics, University of Leeds

Anil Shah, University of Kassel

Dawa Sherpa, Jawaharlal Nehru University 

Hee-Young Shin, Wright State University

Farwa Sial, Global Development Institute, University of Manchester

Crystal Simeoni, FEMNET, Nairobi, Kenya

Engelbert Stockhammer, King’s College London

Ndongo Samba Sylla, Dakar

Carolyn Sissoko, UWE Bristol

Celine Tan, University of Warwick

Gyekye Tanoh, Accra

Daniela Tavasci, School of Economics and Finance, Queen Mary University of London

Andrea Terzi, Franklin University Switzerland 

Daniele Tori, Open University Business School

Gamze Erdem Türkelli, University of Antwerp

Esra Ugurlu, University of Massachusetts Amherst

Ezgi Unsal, Kadir Has University

Tara Van Ho, University of Essex 

Sophie Van Huellen, SOAS University of London

Frank Van Lerven, New Economics Foundation

Elisa Van Waeyenberge, SOAS University of London

Paolo Vargiu, University of Leicester

Luigi Ventimiglia, School of Economics and Finance, Queen Mary University of London

Apostolos Vetsikas, University of Thessaly, Greece

Davide Villani, The Open University and Goldsmiths, University of London

Camila Villard Duran, University of Sao Paulo

Pablo Wahren, University of Buenos Aires

Neil Warner, London School of Economics

Mary Wrenn, UWE Bristol

Joscha Wullweber, University of Witten/Herdecke

Devrim Yilmaz, Université Sorbonne Paris Nord

MMT: History, theory and politics

Originally published in Spanish as “¿De dónde viene el dinero?” by Política Exterior

Modern monetary theory, or MMT as it is widely known, has achieved remarkable visibility in recent years. Despite the title, MMT can resemble a political campaign as much as a monetary theory, characterised by activists promoting job guarantee schemes alongside more scholarly activity. The core ideas of MMT coalesced in the early 1990s, developed and promoted by a small group who largely bypassed academia, instead using blogs to accumulate a dedicated band of followers. As Bill Mitchell, one of the founders of MMT, said at the recent “International MMT Conference” in New York, “This is the first body of economic theory that has grown through activists”. In recent years that following has expanded substantially, leading to global prominence for key MMT figures, and widespread media coverage and commentary.

The main propositions of MMT are derived from one simple observation: a country with its own currency cannot run out of that currency. The U.S. government cannot run out of dollars because dollars are issued by the Federal Reserve, which is controlled by the U.S government. As a result, the U.S. government will never face a situation in which it cannot find the money to pay the interest on its debt, to hire workers, or to purchase goods and services. This, MMT proponents argue, turns conventional thinking on its head: mainstream economics promotes misconceptions about public debt, imposing false barriers to public spending. In contrast, it is claimed, MMT identifies the true constraints faced by currency-issuing governments, liberating policy-makers from misguided concerns about “finding the money” to pay for government spending.

The reality, as we shall see, is a bit more complicated. But first, some history. The MMT story starts with Warren Mosler, an ex-Wall Street trader who, in the 1980s, founded both a hedge fund and a supercar manufacturer, before relocating to the Virgin Islands, a Caribbean tax haven. In the early 1990s, Mosler took his ideas on sovereign debt to Donald Rumsfeld who sent him to Arthur Laffer (of “Laffer Curve” fame). Laffer told Mosler that the high priests of economic orthodoxy were unlikely to be interested in his ideas, and suggested he instead try the Post-Keynesians: a group of left-leaning non-mainstream economists. Mosler joined a Post-Keynesian email discussion list and found common ground with academics such as L. Randall Wray and his colleagues in the US, and Bill Mitchell in Australia. The group embarked on the project of developing a new synthesis of ideas on monetary economics.

Mosler convinced the group that the commonly held view that taxes provide the funds required for government spending is false. Instead, when a currency-issuing government spends, it creates new money: when the U.S. government makes a payment, new dollars are brought into existence at the point of expenditure. Discussions framed in terms such as “where will the government find the money?” are therefore based on a flawed understanding of the monetary system, Mosler argues.

According to Mosler, the purpose of taxation is instead to create the demand for government-issued currency. In the absence of taxes, Mosler contends, there would be no demand for essentially worthless pieces of paper. But in declaring and imposing the unit (the dollar) in which tax obligations must be discharged, the government ensures widespread use and acceptability of its currency.

These ideas turned out to be compatible with those of Randall Wray, an academic who was working on “Chartalist” ideas concerning the role of the state in defining and enforcing what is used as money. In the Chartalist view, money is not and has never been a commodity such as gold. Instead, money is essentially a system of IOUs that keeps track of credit and debit positions across a society too large and complex to rely on direct credit relationships. While credit theories of money have a longstanding tradition, the novelty of Chartalism lies with the claim that “money is a creature of the state”. By imposing the use of its own currency, Chartalists argue, the government, as monopoly issuer of that currency, attains powers not available to any other economic actor.

The core of MMT is a synthesis of Mosler and Wray’s ideas about government money with elements such as Abba Lerner’s “functional finance”. Lerner argues that government finances are not appropriate targets for government policy. Instead, the government should judge its actions on the basis of real outcomes, such as the level of employment. When combined with Mosler’s assertion that a currency-issuing government is never unable to service its debt, the claim that the appropriate target for macroeconomic policy is full employment appears logical. For MMT, the limit to government spending is therefore not financial but real, imposed by the physical capacity of the economic system to produce goods and services. The limit to fiscal activism is therefore the “inflation barrier” – the point at which increases in government spending generate rising prices, rather than higher employment and production.

The last piece of the MMT puzzle is the “employer of last resort” policy. Functional finance says that government spending should be used to eliminate unemployment – but there is a catch. As unemployment is reduced, inflation is likely to strengthen. It is unlikely that true zero unemployment can be achieved simply by raising government spending: at some point inflation will set in.

The employer of last resort (ELR) is MMT’s proposed solution to this problem. The policy is deceptively simple: the government should stand ready to employ all those who want work, offering a wage set at a level below the prevailing private sector wage rate. The justification claimed is twofold. First the policy will eliminate the social ill of unemployment: all those who want work will have it. Second, by setting wages below the level in the private sector, the ELR will create a “nominal anchor”: the below-market-rate ELR wage will restrain wage demands across the economy, preventing inflation, even in the absence of unemployment. When inflation sets in, the government should respond by reducing total spending, leading to lay-offs in the private sector. These laid off workers will be picked up by the ELR, at lower wages than the private sector. This increase in the “buffer stock” of ELR workers will serve to dampen wage demands in the private sector, reducing inflationary pressure.

These three elements: sovereign money, functional finance and the employer of last resort comprise the theoretical and policy core of MMT.

Before assessing whether this provides a sound basis for policy, we need to first briefly consider some history of the relationship between economic theory and macroeconomic policy. In the advanced economic nations, the post-war years were characterised by rapid growth and very low unemployment rates. By the middle of 1970s, this benign macroeconomic environment had given way to oil price hikes, the breakdown of the Bretton Woods managed exchange rate system and rising labour militancy. Policy-makers switched their focus from employment to inflation: the influence of Milton Friedman’s monetarism led to a growing belief that using macroeconomic policy for anything other than controlling inflation was futile, and that employment should be abandoned as a policy target. Through the 1980s and 1990s, academic economics coalesced around an increasingly mathematical formalisation of Friedman’s ideas (confusingly, this acquired the title of “New Keynesian economics”). While mathematically complex, this boils down to three main propositions.

First, total spending by households and businesses – what economists refer to as aggregate demand – is determined, in the short run, by the rate of interest. Since the rate of interest is assumed to be under the control of the central bank, total spending is therefore under direct policy control. Second, inflation is determined by two factors: firstly by total spending relative to the productive capacity of the economy and, secondly, by expectations about future inflation. In this view, if inflation is too high, the central bank should raise the rate of interest, reducing total spending and thus reducing inflationary pressure. The speed at which inflation will return to target will depend on the “credibility” of the central bank: if households and businesses believe that the central bank is serious about getting inflation under control, even at the cost of higher short-run unemployment, then inflation will adjust quickly. The conclusion – the third proposition – is that the optimal way to implement macroeconomic policy is for an independent central bank to adopt a policy rule, explicitly stating how it will adjust interest rates when inflation is above target. This, it is argued, is the most effective way to ensure that the central bank is credible – and is not susceptible to politicians seeking to temporarily lower unemployment as a way to improve their electoral prospects.

A small group of dissenting “heterodox” economists maintained a position of opposition to the ascendancy of monetarist ideas, arguing that Friedman’s diagnosis relied on an over-simplified view of inflation as the result of “too much money chasing too few goods”. Drawing inspiration from Keynes and his contemporaries Michal Kalecki, Joan Robinson and Nicholas Kaldor, this group adopted the term “Post-Keynesian” to distinguish their position from that of the mainstream. The Post-Keynesians rejected the key monetarist assertion that the central bank can always influence economic activity by adjusting either the quantity of money or the policy rate of interest. As Keynes put it, monetary policy is like “pushing on a string”: tighter policy will dampen economic activity, but looser policy will not automatically act as a stimulus. Fiscal policy is therefore required for macroeconomic stabilisation.

From around the mid-1970s, Post-Keynesian economics was characterised by a transatlantic division of labour. In the UK, with Cambridge at the centre, much attention was focused on growth and distribution. In the US, a closer interest was taken in monetary and financial issues. It was with members of this group of US Post-Keynesians that Mosler formed an alliance in the 1990s. Mosler’s financial backing enabled institutional support at the University of Missouri-Kansas, where several prominent MMT developers gained employment, including a PhD training programme to incubate the next generation of MMT advocates.

While the theoretical core of MMT is close to the ideas of Post-Keynesian economics, MMT stole a march on their Post-Keynesians colleagues in exploiting social media and non-academic activism. With hindsight, however, these tactics turn out to be something of a double-edged sword: success relied on the use of slogans such as “money doesn’t grow on rich people”, “taxes don’t pay for spending” and “money is no object”. These slogans, and the zeal with which advocates adopted them, arguably serve to obscure the underlying ideas, making MMT claims appear more groundbreaking than is really the case.

Take the claim that “taxes don’t pay for spending”. It has long been taught in elementary macroeconomics classes that government spending adds to total national expenditure, while taxes are a deduction. The two variables are treated as moving independently of one another: taxation doesn’t constrain government spending. Since at least the time of Keynes, it has been understood that tax plays an important macroeconomic role in limiting total private sector spending, thus ensuring that economic capacity is available for government programmes. Whether this function should be characterised as taxes “paying for” spending is perhaps semantic.

Textbooks usually explain that the gap between government spending and taxation is covered by issuance of government bonds. MMT goes further, claiming that government spending is not financed by either taxes or bond issuance: Governments first spend, creating new money, then withdraw money from circulation by imposing taxes or issuing bonds. As a result, MMT proponents claim, taxes can be cut dramatically, without affecting the ability of government to spend, while bond issuance can be eliminated entirely.

Does MMT provide a good guide for policy? MMT proponents tend to deny that MMT provides policy proposals. Instead, it is claimed, MMT is a “lens” through which one comprehends the true nature of the monetary system. MMT is not a policy package, it is argued, because MMT is simply a description of how the system already works.

This claim stretches credibility. Putting the ELR proposal aside, MMT proponents do make policy proposals (such as those already noted). The common feature of such proposals is the use of deficit monetisation: issuing central bank money directly to pay for government programmes. For example, Warren Mosler proposes abolishing all payroll taxes, while Stephanie Kelton has argued that the Green New Deal, a massive public spending programme championed by the left of Democratic Party, can be implemented without needing to tax the wealthy.

Complaints by proponents that MMT is mischaracterised as “printing money” are therefore misplaced. The suggestion that MMT claims “deficits don’t matter” likewise causes protest: MMT proponents respond that deficits matter, but what matters is the so-called “real resource constraint”. As a result, as MMT proponents correctly note, deficits can be too small as well as too large – an obvious current example is Germany, where demand clearly falls short of real constraints, and there is substantial capacity for fiscal expansion. Despits this, MMT complaints are again misleading: MMT does argue that there is no financial constraint to government deficits. While it is almost certainly the case that the US and other advanced nations still have substantial fiscal space, despite running large deficits in some cases, the MMT claim is too extreme; at some point, fiscal limits will be reached even in rich nations. For countries further down the international currency hierarchy which face binding externally-imposed constraints related to foreign exchange needs, fiscal limits are very real.

Further, despite MMT proponents emphasising the “inflation barrier” as the true limit to deficit spending, little effort is devoted to the crucial questions of how real resources are to be mobilised: how to ensure that large government spending programmes such as the Green New Deal can be implemented without hitting supply side bottlenecks, capacity limits and political resistance. In framing everything in monetary terms, rather than real economic activity, MMT therefore obscures rather than illuminates important macroeconomic relationships.

Once the esoteric use of language and the more extreme claims are stripped away, there is arguably a rather conventional core to MMT. US economists JW Mason and Arun Jayadev argue that, in policy terms, MMT effectively amounts to a reversal of the “consensus assignment”. This refers to the idea that the two main tools of macroeconomic management, fiscal policy and monetary policy, should each be assigned a single target. The consensus assignment is that monetary policy (setting interest rates and, more recently, quantitative easing) should be used to manage aggregate demand, while fiscal policy is used to maintain sustainable debt-to-GDP ratios. In contrast, MMT proposes the use of fiscal policy to manage demand, and monetary policy (in the form of deficit monetisation and zero interest rates) to manage the public finances.

MMT is usually portrayed as a left-wing economic programme: Stephanie Kelton is an economic advisor to Bernie Sanders and Alexandria Ocasio-Cortez has said that MMT should be “part of the conversation”. But although much of the MMT activist base is on the left, the relationship between MMT and politics is more complex. The line that “money doesn’t grow on rich people” can potentially play well on the right, as much as the left. As already noted, Mosler, a self-described “Tea Party Democrat” proposes the abolition of payroll taxes. Bill Mitchell argues that MMT is politically neutral, and MMT insights can inform either left- or right-wing political programmes. Care therefore needs to be taken when associating government deficits with the political left: US Republicans use deficit scaremongering to constrain public spending by Democrat administrations, but Republican governments are often less fiscally cautious in office — Trump’s tax cuts provide a recent example. Similarly, in the UK, after nearly a decade of government cuts premised on the false threat of a run on bond markets, the Conservative government has decided to embrace deficits, cutting taxes and making eye-catching spending claims.

The ideas of MMT could also be adopted by political groups that combine socially right-wing ideas with activist fiscal policy. In their recent book, “Reclaiming The State”, Bill Mitchell and his co-author Thomas Fazi note the successful use of deficit monetisation in Nazi Germany, while decrying the “tragedy” of the Left’s focus in recent decades on “identity politics”: opposition to racism, homophobia and other forms of bigotry. This, Mitchell argues, serves to radicalise the “ethnocentrism of the proletariat”. This framing of MMT in terms of national sovereignty will have obvious appeal to those wishing to implement nativist policies, such as restricting migration, while using deficit spending to ensure employment for those on the inside.

MMT has had remarkable success in opposing needless deficit hysteria and in popularising more enlightened ideas on macroeconomic management than those prevailing since the rise of monetarism in the 1970s. Recent events have demonstrated the ineffectiveness of monetary policy as a demand management tool: it is now widely accepted that fiscal policy must play a more active role. MMT activists should therefore be commended: they have succeeded where other heterodox economists have failed in popularising these important ideas. But the use of obscurantist language, oversimplification of complex issues and the tendency to make excessive claims ultimately undermines their case.

Time will tell if MMT is destined to become a passing phase or a more permanent “part of the conversation”. What seems more certain is that the days of reliance on monetary policy as the sole macroeconomic stabilisation tool are over: fiscal policy is back on the agenda.

Brexit voting patterns, education and geography

Rob Calvert Jump and Jo Michell

We have a “featured graphic” article on Brexit voting patterns and education forthcoming in Environment and Planning A. The electronic version is here, and an ungated pre-print is here.

It is by now well established that education is one of the most statistically important demographic factors in “explaining” the Brexit vote. It also has substantial predictive power. What has not been explored, to our knowledge, is the extent to which educational attainment and geography interact: scatter plots and regressions tell us how variables move together, but they don’t (usually) include information about geographical patterns.

The figure below demonstrates why such information might be important (hi-res version here). The maps show colour-coded Leave vote percentages by local authority. Black outlines denote authorities for which the proportion of the population with less than five GCSEs is below the national average of around 36%. The match between low GCSE attainment and Brexit votes is striking: only 4 of the 85 local authorities that voted Remain had lower than average high school educational attainment: Liverpool, Sefton, the Wirral, and Leicester (researchers have recently speculated that Liverpool’s Remain vote was influenced by the city’s boycott of The Sun) Conversely, there is only a single local authority, North Kesteven in the East Midlands, with better than average educational attainment and a Leave vote share of 60% or higher.

Map of Leave votes and educational attainment
Choropleth map and cartogram hex map of Leave vote share and educational attainment in England and Wales by local authority.

Areas of below-average educational attainment and strong Leave voting show a clear geographical structure: clusters extend from the east coast into Essex and Kent in the south, and into the West Midlands and the north west of England in the north. The correlation does not hold so well in Wales, Cumbria, Northumberland and County Durham, where several local authorities with below-average GCSE attainment returned Leave votes between 50% and 60%.

Simple bivariate correlations like this are of course likely to be confounded by other factors that covary with aggregate educational attainment: age is the most obvious. To test the extent to which this may be driving the result, we construct a measure of age-adjusted educational attainment, which adjusts for the age and sex structure of the local authority – the details are in the paper. The figure below shows how this measure correlates with Leave voting (hi-res version).

Map of Leave votes shares and age-adjusted educational attainment
Choropleth map and cartogram hex map of Leave vote share and age-adjusted educational attainment in England and Wales by local authority

Once age and sex are adjusted for, the extent to which low GSCE attainment is clustered strongly among parts of the east coast, the West Midlands and the North West is even more apparent. Again the match with strong Leave votes is striking. Adjusting for age and sex removes many of the local authorities returning Leave votes between 50% and 60% from the “below average” educational attainment category, although parts of Wales are still apparent “outliers”. The area of below average (adjusted) educational attainment also extends into Remain-voting East London and Manchester.

How should these patterns be interpreted in light of the various narratives seeking explain the Brexit vote? These can broadly be divided into those emphasising cultural divergence between socially liberal Remain voters and socially conservative Leave voters, and those emphasising economic drivers such as inequality, austerity, and the effects of globalisation. Since educational attainment is closely correlated with both social attitudes and economic success, our results could be invoked in favour of either set of narratives. We therefore caution against drawing any firm conclusions on the basis of these results. The distribution of strong Brexit votes and below average educational attainment does raise potential problems, however, for narratives of the vote based on an assumed North-South divide. More on this soon.