Hunt versus headroom

Rob Calvert Jump and Jo Michell

Just over a year ago, ahead of Jeremy Hunt’s first Autumn Statement, we published a report on how UK public finances are managed and discussed. At the time, the media was awash with claims of a ‘black hole’ in the public finances. We pointed out that this was incoherent because the so-called black hole was nothing more than the difference between an arbitrary fiscal rule and an uncertain forecast.

We also pointed out that forecasts of public debt are highly sensitive to the assumed path of variables such as nominal GDP growth. The latest Autumn Statement and its accompanying OBR projections provide a case in point.

In the run up to the Statement, the media focus had switched from black holes to ‘fiscal headroom‘. This was reported to be around £20bn, and is a measure of the size of the fall in the public debt in the fifth year of the OBR’s forecast – a ‘black hole’ with the sign reversed.

The figure below shows the last three forecasts of public debt from the OBR, along with the historical data published at the time of the forecast. Since the Autumn Statement a year ago, the level of public debt in the final year of the forecasts has fallen from 97.3% of GDP in the November 2022 forecast, to 92.8% of GDP in the most recent one. This forecast revision amounts to nearly £150bn of 2028-29 GDP.

Figure of OBR debt to GDP forecasts

Is this £150bn improvement in the forecast the result of policy actions taken by the government? And if so, why is all the talk of £20bn of headroom, rather than £150bn? The answer to the first question is a firm ‘no’. These shifts in the forecast have nothing to do with policy, and are driven entirely by data revisions and changes in the OBR’s macroeconomic forecasts.

Recent revisions to GDP have shown a stronger recovery from the pandemic than previously thought, alongside higher than expected inflation. As a result, nominal GDP is substantially higher than it was a year ago, and so the debt to GDP ratio is lower. 

In the space of a year, data revisions and revised expectations about inflation have, therefore, swamped any change in the debt level driven by policy. Shifts in the positions of the series are far greater than the marginal change between the final two data points – the so-called ‘headroom’ which receives so much attention.

What about the second question? Why are we not talking about £150bn of headroom? The answer to this is unclear, but it is probably the case that the Chancellor of the Exchequer is not actively considering every possible trajectory for the public debt that satisfies his fiscal rules. If he did so, he could substantially increase public spending in a manner that would leave debt falling, as a percentage of GDP, by the end of the OBR’s forecast period.

Consider, for example, the OBR’s November 2023 forecasts for the main fiscal aggregates, displayed in the table below. Public sector net debt, as a percentage of GDP, falls from 93.2% in 2027-28 to 92.8% in 2028-29. Public sector net borrowing is less than 3% of GDP in 2028-29. As a result, the government’s two fiscal targets are met.

yeargdpgdp_centredpsndpsnbgilt_ratepsnd_pctpsnb_pct
2022-23255226502251128.33.1384.945.03
2023-24272627612458123.94.589.034.55
2024-2527982841260384.64.5291.623.02
2025-2628872938272476.84.5592.722.66
2026-2729953051284568.44.6293.252.28
2027-2831063162294749.14.7493.21.58
2028-2932183274303935.04.8892.821.09
OBR forecasts in the November 2023 Economic and Fiscal Outlook.

Now, consider a counterfactual increase in public investment, by £10bn in 2024-25, £15bn in 2025-26, £20bn in 2026-27, £28bn in 2027-28, and then £10bn in 2028-29. This looks something like the Labour Party’s proposed green new deal, in which annual public investment would increase to £28bn over a single parliament. For simplicity we assume multipliers of zero and no impact on inflation, so that nominal GDP is unchanged from the OBR forecasts.

How would this affect public sector borrowing? In 2024-25, it would increase (relative to the OBR’s baseline forecast in table 1) by £10bn. In 2025-26 it would increase by £15bn plus interest payments on the previous year’s £10bn. In 2026-27 it would increase by a further £20bn, plus interest payments on the previous two years’ borrowing, and so on. The resulting time paths for borrowing and debt are displayed in table 2, below.

yeargdpgdp_centredpsndpsnbgilt_ratepsnd_pctpsnb_pct
2022-23255226502251128.33.1384.945.03
2023-24272627612458123.94.589.034.55
2024-2527982841261394.64.5291.973.38
2025-26288729382749.4692.264.5593.583.2
2026-27299530512891.6389.584.6294.782.99
2027-28310631623023.8479.314.7495.632.55
2028-29321832743129.5948.754.8895.591.51
Counterfactual government spending path based on OBR forecasts.

Public sector net debt, as a percentage of GDP, now peaks at a higher level: 95.63% rather than 93.25%.  But it is still falling between 2027-28 and 2028-29, and public sector net borrowing is still less than 3% of GDP in 2028-29. As a result, the government’s fiscal targets are still met.

This counterfactual trajectory of debt-to-GDP, alongside the OBR’s recent forecasts are plotted in the figure below. Our counterfactual trajectory is not dissimilar to the OBR’s forecast from March 2023. The end of forecast debt/GDP is around two percentage points of GDP lower than in the November 22 forecast, in which Hunt had defeated the black hole and met his fiscal rules. Given that this was regarded as a success only a year ago, on what basis could our counterfactual trajectory be rejected?

Counterfactual debt to GDP scenario

It is clear that ‘headroom’ as reported in the media is not simply a measure of the amount of money that the Chancellor could spend without breaching his fiscal rules. In fact, given its complicated nature, there is no single number that summarises the amount of extra spending consistent with a headline fiscal rule defined by the rate of change of debt-to-GDP at a future point in time. It depends on the distribution of extra spending over the forecast period, as well as the time path of interest rates.

Moreover – and this is, perhaps, more important – it depends on the volatility of the forecasts themselves. The difficulties involved in forecasting economic and fiscal aggregates over a five year horizon is illustrated by pre-budget forecasting exercises published by the Institute of Fiscal Studies and the Resolution Foundation. Their estimates of public debt as a share of GDP at the end of the forecast period differ by nearly 10 percentage points – over £300bn. Minor adjustments to the assumptions that generate these forecasts lead to outcomes an order of magnitude greater than the ‘headroom’ which attracts so much attention.

This is not a rational basis on which to conduct the planning of long-term spending and taxation. It is clear that Hunt’s budget is an exercise in gaming the system. Current nominal tax cuts are ‘paid for’ by creating ‘headroom’ which results from imprecisely specified cuts to government spending towards the end of the forecast period. Moreover, the widely-quoted ‘headroom’ figures have no correspondence whatsoever to the amount of extra money the Chancellor could spend while meeting his rules, and any policy effects are swamped by revisions to the data and forecasts. 

As Paul Johnson, head of the Institute for Fiscal studies says, “Aiming for debt to fall in a particular year is not a good fiscal rule”. Simon Wren-Lewis puts it even more bluntly: “falling debt to GDP is a silly rule”.

G7 growth rates and austerity

Rob Calvert Jump and Jo Michell

In August 2022, revisions to official measures of UK output generated headlines because the new figures implied that the economic contraction during the pandemic was greater than previously thought. 

At the same time, however, substantial revisions were made to historical data, and these received far less attention. One outcome of these revisions is that the UK’s performance relative to other rich economies during the austerity period of 2010–2016 has been downgraded: growth in real GDP per capita over this period is now meaningfully lower. This means that some recent analyses relying on the older figures are misleading.

For example, in a recent FT article, Chris Giles includes data showing that the UK had the highest growth of real GDP per head in the G7 between 2010 and 2016. Inevitably, the article was circulated by defenders of austerity including Rupert Harrison and Tim Pitt, alongside a claim that the data “shows why the idea austerity has caused our growth problems post-GFC doesn’t stack up. During peak austerity (2010-6) UK had strongest GDP per capita growth in G7”.

The data used by Chris Giles are from the International Monetary Fund’s (IMF) October 2022 World Economic Outlook (WEO), and show average annual growth in real GDP per head of 1.4% in the UK between 2010 and 2016, compared with 1.3% in both Germany and the USA. But the October 2022 WEO uses data from the 2021 Blue Book, which were compiled before the most recent set of revisions were introduced.

The 2021 data imply that total per capita growth between 2010 and 2016 was 8.39% in the UK, compared with 8.36% in Germany and 8.27% in the USA. On these numbers, the UK is indeed the highest, albeit by a margin in the second decimal place: under a billion pounds separates the UK and Germany. (This very slim margin appears larger in the FT chart due to growth rates being annualised and then rounded to 1 decimal place, implying UK growth of 8.7% versus German growth of 8.1%, a difference of 0.6 percentage points rather than the actual difference in the IMF data of 0.03 percentage points.)

However, according to the revised figures, real per capita growth in the UK over this period was only 7.7%: total nominal GDP growth between 2010 and 2016 was revised down by around one percentage point in the 2022 data, culminating in lower cash GDP of around £17 billion by 2016.  Smaller adjustments to inflation estimates mean that real GDP growth was revised down by around 0.7 percentage points, from 13.4% to 12.7%. Alongside unchanged population estimates, the result is that official real GDP per capita was revised down by around £340 (in 2019 prices) by 2016 – an amount approximately equal to a third of the average household energy bill in that year.

Chart showing downward revisions to UK nominal GDP growth between 2011 and 2016

These revisions are summarised by the ONS here, and their sources are discussed here. The bulk of the revisions are due to the contribution of the insurance industry to GDP being revised down by the use of Solvency II regulatory data, as well as improvements to the way pension schemes are measured. In addition, and of particular relevance for the current exercise, part of the revisions are due to the ONS, “bringing through a package of sources and methods changes that improve the international comparability of the UK gross domestic product (GDP) estimates.” 

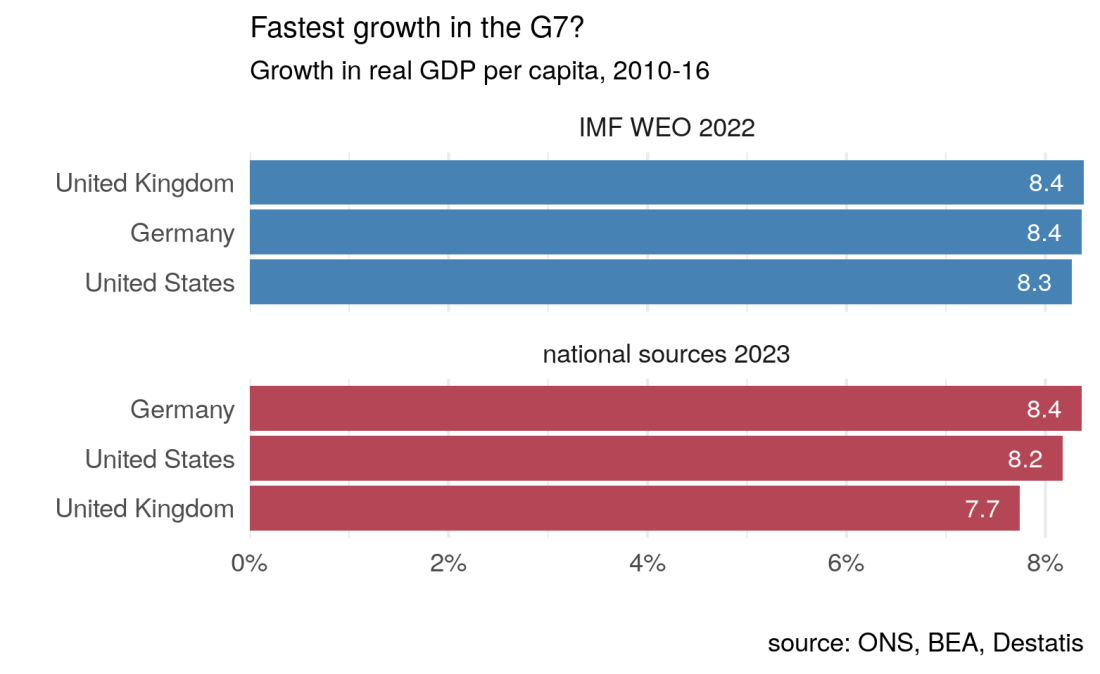
These revisions make a material difference to UK GDP, as well as its international ranking. On the basis of the latest official figures taken directly from national statistical agencies, real UK per capita growth of 7.7% during the austerity period compares with 8.4% for Germany and 8.2% for the US.

Chart comparing growth rates in US, UK and Germany between 2010 and 2016.

So, based on the most recent data, the UK did not have the fastest growth in GDP per capita between 2010 and 2016. 

Aside from this, as others have noted, focusing narrowly on the 2010-2016 period is potentially misleading. When austerity was implemented, the UK was in the process of recovering from the 2008 recession. It is likely that there was substantial spare capacity which, under strong demand conditions, could have been quickly reabsorbed into economic activity. If we start our comparison at the pre-crisis peak (2007 for the UK and US, 2008 for Germany), rather than 2010, the divergence is much greater: by 2016, real UK GDP per capita had increased by 2.8% on its pre-crisis level, compared with 5.5% for the US and 7.1% for Germany. Much of UK growth during between 2010 and 2016 was recovering losses from the recession: GDP per capita did not reach pre-2008 levels until 2014, compared to 2011 for Germany and 2012 for the US.

As Chris Giles notes, “Most economists now accept that the sharp reductions in public spending between 2010 and 2015 delayed the recovery from the financial crisis”. Comparing outcomes with pre-crisis levels is not, therefore, “baseline bingo” as claimed by Rupert Harrison. These outcomes are hard to square with Harrison’s claim that this is “what catch up looks like”.

Chart showing real GDP per capita between 2007 and 2016 in US, UK and Germany

These data revisions highlight the dangers in drawing strong conclusions – particularly about politically loaded topics – from small differences in data that are subject to measurement error and revision. It is inevitable that an FT article claiming that UK growth per head was highest in the G7 during the main austerity years will be used as justification for austerity policies. But, on the basis of the most recent and accurate data available, the claim is false. UK GDP growth was relatively strong by international standards (and may yet be revised back to the top of the table) but this statement ought to be placed in its proper context, using a variety of data sources and an understanding of their strengths and weaknesses.

Nominal GDP (YBHA)Real GDP (ABMI)
Year2021 Blue Book2022 Blue Book2021 Blue Book2022 Blue BookIMF 2022 WEO
20101,612,1951,612,3811,884,5151,876,0581,884,515
20111,669,5091,664,2111,911,9831,896,0871,911,983
20121,721,3551,713,2411,940,0871,923,5511,940,087
20131,793,1551,782,2961,976,7551,958,5571,976,755
20141,876,1621,862,8272,035,8832,021,2252,035,883
20151,935,2121,920,9982,089,2762,069,5952,089,276
20162,016,6381,999,4612,136,5662,114,4062,136,566

Data are in millions of pounds (2019 pounds for the real data). Data downloaded from ONS and IMF websites on 20th March 2023. Note that the 2022 Blue Book dataset was only published on the 31st October 2022, too late for inclusion in the IMF’s October 2022 World Economic Outlook. The revisions were initially introduced (and reported on) in August 2022, the quarter before the Blue Book publication.

Fiscal silly season

We are entering fiscal silly season. As the budget approaches, we should brace for impact with breathless reporting of context-free statistics about inflation, interest rates and government debt.

The story is likely to go something like this. Inflation is rising. This raises costs on government debt because some of it (index-linked bonds) pays an interest rate linked to inflation. Costs associated with quantitative easing (QE) will also increase because QE is financed by central bank reserves which pay Bank Rate (the Bank of England’s policy rate of interest). Since inflation is rising the Bank will have to raise interest rates to control it. This will increase the financing costs of QE and the cost of issuing new debt for the Treasury.

The conclusion — sometimes implied, sometimes explicit — is usually some version of “the situation is unsustainable therefore the government will have to make cuts”.

While each part of the story is technically correct in isolation, the overall narrative — debt is out of control and the situation is going to get worse because of inflation — doesn’t stand up to scrutiny.

These stories are rarely presented with sufficient context. Instead, journalists tend to rely on statistical soundbites such as “public debt is the highest since … ”. This is rarely if ever accompanied by the fact that debt/GDP is a fairly meaningless number.

The problems associated with government debt essentially boil down to the fact that debt involves redistribution. In the case of the government this means redistribution in the form of transfers from tax payers to bond holders. This is politically difficult. (This is also why “but currency issuer …” responses to these issues are largely beside the point — the problems of debt management are ultimately political not technical).

The ratio of debt to GDP tells us very little about the current political difficulties arising from debt servicing. Instead, the relevant magnitudes are total interest payments and tax revenues.

Total interest payments are equal to the debt stock multiplied by the effective interest rate on government debt. Focusing on the debt stock in isolation is thus equivalent to representing the area of a rectangle by the length of one side.

A better indicator of the risks associated with public debt is the ratio of government interest payments to tax revenues, as plotted in the figure below.

source: macroflow

Interest payments on government debt have indeed risen recently. A spike in June triggered media articles about the highest interest payments on record. In context, such statistics are shown to be meaningless. Interest payment have risen to around 6% of taxation over a four quarter period, compared with all-time lows of about 5.3%. (Calculated on a 12 monthly basis this rises to around 6.5%). It is hard to see signs that the sky is falling.

In fact, this indicator overstates current interest costs. This is because much of the interest paid by the Treasury is paid to the Bank of England which holds a substantial chunk (currently around 37%) of UK government debt as a result of QE (see chart below). Most of this interest is returned directly to the Treasury. Since the start of QE, this has saved the Treasury over £100bn in interest costs.

source: macroflow

Adjusting for this reduction in interest payments produces the figure below: net interest payments sum to around 4.7% of tax revenues over the last four quarters (or 5.2% on a rolling 12 monthly basis).

source: macroflow

What of the dangers ahead? It is true that if inflation rises, then interest costs will rise, all else equal. But the scale of these rises is not predetermined, and will be affected by policy.

First, persistent inflation is far from a certainty. If if inflation does persist in the short term, the Bank does not need to raise interest rates. Hikes in response to price pressures due to pandemic reopening and supply side bottlenecks will do more harm than good — instead the Bank should wait until the economic recovery is clearly underway. In this context, interest rate increases would likely be a good sign, and would be offset by rising tax revenues. Further, the Bank could introduce a “tiered reserve” system which would serve to hold down the rate paid on a substantial proportion of outstanding debt. Short term and index-linked debt can be rolled over at longer maturities, delaying the point at which higher rates would feed into higher interest payments.

In summary, simple claims such as “a one percentage point rise in interest rates and inflation could cost the Treasury about £25bn a year” are not useful without context and explanation of the long list of assumptions required to produce such a figure. The policy conclusions derived from such claims should be taken with a large pinch of salt.

Season’s Greetings and enjoy the festive period!

Misunderstanding MMT

MMT continues to generate debate. Recent contributions include Jonathan Portes’ critique in Prospect and Stephanie Kelton’s Bloomberg op-ed downplaying the AOC and Warren tax proposals.

Something that caught my eye in Jonathans’ discussion was this quote from Richard Murphy: “A government with a balanced budget necessarily denies an economy the funds it needs to function.” This is an odd claim, and not something that follows from MMT.

Richard has responded to Jonathan’s article, predictably enough with straw man accusations, and declaring, somewhat grandiosely, that “the left and Labour really do need to adopt the core ideas of modern monetary theory … This debate is now at the heart of what it is to be on the left”

Richard included a six-point definition of what he regards to be the core propositions of MMT. Paraphrasing in some cases, these are:

  1. All money is created by the state or other banks acting under state licence
  2. Money only has value because the government promises to back it …
  3. … because taxes must be paid in government-issued money
  4. Therefore government spending comes before taxation
  5. Government deficits are necessary and good because without them the means to make settlement would not exist in our economy
  6. This liberates us to think entirely afresh about fiscal policy

Of these, I’d say the first is true, with some caveats, the second and third are partially true, and the fourth is sort of true but also not particularly interesting. I’ll leave further elaboration for another time, because I want to focus on point five, which is almost a restatement of the quote in Jonathan’s Prospect piece.

This claim is neither correct nor part of MMT. I don’t believe that any of the core MMT scholars would argue that deficits are required to ensure that there is sufficient money in circulation. (Since Richard uses the term “funds” in the first quote and “means [of] settlement” in the second, I’m going to assume he means money).

To see why, consider what makes up “money” in a modern monetary system. Bank deposits are the bulk of the money we use. These are issued by private banks when they make loans. Bank notes, issued by the Bank of England make up a much smaller proportion of the money in the hands of the public. Finally, there are the balances that private banks hold at the Bank of England, called reserves.

What is the relationship between these types of money and the government surplus or deficit? The figure below shows how both deposits and reserves have changed over time, alongside the deficit.

uk-money-supply-deficit

Can you spot a connection between the deficit and either of the two money measures? No, that’s because there isn’t one — and there is no reason to expect one.

Reserves increase when the Bank of England lends to commercial banks or purchases assets from the private sector. Deposits increase when commercial banks lend to households or firms. Until 2008, the Bank of England’s inflation targeting framework meant it aimed to keep the amount of reserves in the system low — it ran a tight balance sheet. Following the crisis, QE was introduced and the Bank rapidly increased reserves by purchasing government debt from private financial institutions. Over this period, and despite the increase in reserves, the ratio of deposits to GDP remained pretty stable.

The quantity of neither reserves nor deposits have any direct relationship with the government deficit. This is because the deficit is financed using bonds. For every £1bn of reserves and deposits created when the government spends in excess of taxation, £1bn of reserves and deposits are withdrawn when the Treasury sells bonds to finance that deficit.

This is exactly what MMT says will happen (although MMT also argues that these bond sales may not always be necessary). So MMT nowhere makes the claim that deficits are required to ensure that the system has enough money to function.

It is true that the smooth operation of the banking and financial system relies on well-functioning markets in government bonds. During the Clinton Presidency there were concerns that budget surpluses might lead the government to pay back all debt, thus leaving the financial system high and dry.

But the UK is not in any danger of running out of government debt. Government surpluses or deficits thus have no bearing on the ability of the monetary system to function.

The macroeconomic reason for running a deficit is straightforward and has nothing to do with money. The government should run a deficit when the desired saving of the private sector exceeds the sum of private investment expenditure and the surplus with the rest of the world. This is not an insight of MMT: it was stated by Kalecki and Keynes in the 1930s.

If a debate about MMT really is at “the heart of what it is to be on the left” then Richard might want to take a break to get up to speed on MMT (and monetary economics) before that debate continues.

“A remarkable national effort”: the dismal arithmetic of austerity

Rob Calvert Jump and Jo Michell

In a recent tweet, George Osborne celebrated the fact that the UK now has a surplus on the government’s current budget. Osborne cited an FT article noting that “… deficit reduction has come at the cost of an unprecedented squeeze in public spending. That squeeze is now showing up in higher waiting times in hospitals for emergency treatment, worse performance measures in prisons, severe cuts in many local authorities and lower satisfaction ratings for GP services.”

It is a measure of how far the debate has departed from reality that widespread degradation of essential public services can be regarded as cause for celebration.

The official objective of fiscal austerity was to put the public finances back on a sustainable path. According to this narrative, government borrowing was out of control as a result of the profligacy of the Labour government. Without a rapid change of policy, the UK faced a fiscal crisis caused by bond investors taking fright and interest rates rising to unsustainable levels.

Is this plausible? To answer, we present alternative scenarios in which actual and projected austerity is significantly reduced and examine the resulting outcomes for national debt.

Public sector net debt (the headline government debt figure) in any year is equal to the debt at the end of the previous year plus the deficit plus adjustments,

jump-deficit-eqn

where PSND  is the public sector net debt at the end of financial year, PSNB is total public sector borrowing (the deficit) over the same year, and ADJ is any non-borrowing adjustment. This adjustment can be inferred from the OBR’s figures for both actual data and projections. In our simulations, we simply take the OBR adjustment figures as constants. Given an assumption about the nominal size of the deficit in each future year, we can then calculate the implied size of the debt over the projection period.

What matters is not the size of the debt in money terms, but as a share of GDP. We therefore also need to know nominal GDP for each future year in our simulations. This is less straightforward because nominal GDP is affected by government spending and taxation. Estimates of the magnitude of this effect – known as the fiscal multiplier – vary significantly. The OBR, for instance, assumes a value of 1.1 for the effect of current government spending.  In order to avoid debate on the correct size of the nominal multiplier, we assume it is equal to zero.[1] This is a very conservative estimate and, like the OBR, we believe the correct value is greater than one. The advantage of this approach is that we can use OBR projections for nominal GDP in our simulations without adjustment.

We simulate three alternative scenarios in which the pace of actual and predicted deficit reduction is slowed by a third, a half and two thirds respectively.[2] The evolution of the public debt-to-GDP ratio in each scenario is shown below, alongside actual figures and current OBR projections based on government plans.

jump-deficit2

jump-deficit

Despite the fact that the deficit is substantially higher in our alternative scenarios, there is little substantive variation in the implied time paths for debt-to-GDP ratios.  In our scenarios, the point at which the debt-to-GDP ratio reaches a peak is delayed by around two years. If the speed of deficit reduction is halved, public debt peaks at around 97% of GDP in 2019-20, compared to the OBR’s projected peak of 86% in the current fiscal year. Given the assumption of zero nominal multipliers, these projections are almost certainly too high: relaxing austerity would have led to higher growth and lower debt-to-GDP ratios.

Now consider the difference in spending.

Halving the speed of deficit reduction would have meant around £10 billion in extra spending in 2011-12, £8 billion in 2012-13, £19 billion in 2013-14, £21 billion in 2014-15, £29 billion extra in 2015-16, and £37 billion extra in 2016-17.  To put these figures into context, £37 billion is around 30% of total health expenditure in 2016-17.  The bedroom tax, on the other hand, was initially estimated to save less than £500 million per year.  These are large sums of money which would have made a material difference to public expenditure.

Would this extra spending have led to a fiscal crisis, as supporters of austerity argue? It is hard to see how a plausible argument can be made that a crisis is substantially more likely with a debt-to-GDP ratio of 97% than of 86%. Several comparable countries maintain higher debt ratios without any hint of funding problems: in 2017, the US figure was around 108%, the Belgian figure around 104%, and the French figure around 97%.

It is now beyond reasonable doubt that austerity led to increases in mortality rates – government cuts caused otherwise avoidable deaths. These could have been avoided without any substantial effect on the debt-to-GDP ratio. The argument that cuts were needed to avoid a fiscal crisis cannot be sustained.


[1] There is surprisingly little research on the size of nominal multipliers – most work focuses on real (i.e. inflation adjusted) multipliers.

[2] We calculate the actual (past years) or projected (future years) percentage change in the nominal deficit from the OBR figures and reduce this by a third, a half and two thirds respectively. The table below provides details of the middle projection where the pace of nominal deficit reduction is reduced by half.

jump-deficit-table

Strong and stable? The Conservatives’ economic record since 2010

In a recent interview, Theresa May was asked by Andrew Neil how the Conservatives would fund their manifesto commitments on NHS spending. Given that the Conservatives chose not to cost their manifesto pledges, May was unable to answer. Instead she simply repeated that the Conservatives are the only party that can deliver the economic growth and stability required to pay for essential public services. When pressed, May’s response was simple: ‘our economic credibility is not in doubt’.

Does the record of the last seven years support May’s claim?

The first statistic always quoted in such discussions is GDP growth. A lot has been made of the latest quarterly GDP figures, showing the UK at the bottom of the G7 league with quarterly GDP growth of just 0.2%. But these numbers actually tell us very little: they refer to a single quarter and are still subject to revision.

It is more useful to look at real GDP per capita over a longer period of time. This tells us the additional ‘real’ income available per person that has been generated. The performance of the G7 countries since the pre-crisis peak in 2007 is shown in the chart below, with the series indexed to 1 in 2007 for each country. (Data are taken from the most recent IMF WEO database.)

G7 GDP per capita, 2007-2016

GDP per capita in the UK only surpassed its pre-crisis level in 2015. By 2016, GDP per capita relative to the pre-crisis level was less than 2% higher than in 2007, putting the UK behind Japan, Germany, the US and Canada, slightly ahead of France, and well ahead of the Italian economy which remains mired in a deep depression. On this measure, the UK’s performance is not particularly impressive.

For most people, wages are a more important gauge of economic performance than GDP per capita. Here, the UK is an outlier. Relative real wage growth in the G7 economies is shown in the table below, alongside the changes in GDP per capita for the period 2007-2015.

Country

% change in GDP per capita, 2007-2015

% change in average real wage, 2007-2015

Canada 3.2 0.8
France -0.2 0.6
Germany 6.3 0.9
Italy -11.7 -0.7
Japan 3.0 -0.2
United Kingdom 0.7 -1.0
United States 3.7 0.5

Despite coming mid-table in terms of GDP per capita, the UK has the worst performance in terms of real wages, which have fallen by an average of 1% per year over the period. Even in depression-struck Italy, wages did not fall so far.

This translates into a fall of almost five percent in the real wage of the typical (median) worker since the crisis, as the chart below shows. This LSE paper, from which the chart is taken, finds that while almost everyone is worse off since the crisis, the youngest have seen the largest falls in income with 18-21-year-olds facing a fall in real wages of over 15%

Chart-3-LSE

With the value of the pound falling since the Brexit vote, inflation is once again eating into real wages and the latest figures show that, after a period of a couple of years in which wages had been recovering, real wages are now falling again and are likely to do so for the next few years. Average earnings are not projected to reach 2007 levels again until 2022 – by then the UK will have gone fifteen years without a pay rise.

A related issue is the UK’s desperately poor productivity performance. ‘Productivity’ here refers to the amount produced per worker on average. As the chart below from the Resolution Foundation shows, the UK has now experienced a decade without any increase in productivity — something which is historically unprecedented.

CHART-productivity

What causes productivity growth is a controversial topic among economists. Until recently, the majority view was that productivity is not affected by government macroeconomic policy. This position (which I disagree with) is increasingly hard to defend. As Simon Wren-Lewis argues here, evidence is mounting that the UK’s productivity disaster is the result of government policy: the Conservatives’ austerity policies have caused flatlining productivity.

Austerity — or, as it was branded at the time, the ‘Long Term Economic Plan‘ — was the central plank of Osborne’s policy from 2010 until the Brexit referendum vote in 2015.

As I and others have argued at length elsewhere, austerity was based on two false premises — ‘lies’ might be more accurate. The first was that excessive spending by Labour was a cause of the 2008 crisis. The second was that the size of the UK’s government debt posed serious and immediate risks that outweighed other concerns.

One thing that almost all macroeconomists agree on is that when recovering from a severe downturn such as 2008 — and with interest rates at nearly zero — the deficit should not be the target of policy. Instead, it should be allowed to expand until the economy has recovered.

Simply put, the deficit should not be used as a yardstick for successful management of an economy in the aftermath of a major economic crisis such as 2008. But since eliminating the deficit was the single most important target of the Conservatives’ so-called Long Term Economic Plan, we should examine the record.

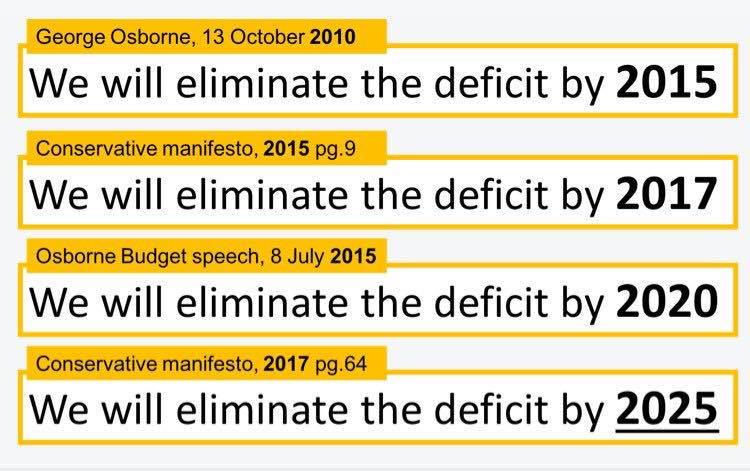
In 2010, Osborne stated that the deficit would be eliminated by 2015. Two years after that deadline passed, the current Conservative manifesto states — in a passage that would not pass any undergraduate economics exam — that they will ‘aim to’ eliminate the deficit by 2025.

Even on their own entirely misguided terms, they have failed completely.

FIG-LTEP

While the dangers of the public debt have been vastly exaggerated by the Conservatives, they have had little to say about private sector debt. It is now widely accepted that the only remaining motor of economic growth is consumption spending. But with wages stagnant, continued growth of consumption cannot be sustained without rising levels of household debt.

This is the reason given when economists are asked why their predictions of post-referendum recession were so wrong: they didn’t anticipate the current credit-driven consumption burst. But this trend has been apparent for at least the last two years. It shouldn’t have been too hard to see this coming.

Chart-Credit-Cards

Just as the Tories tend to stay quiet on private debt, they also have little to say about the ‘other’ deficit — the current account deficit. This is a measure of how much the country is reliant on foreigners to finance our spending. The deficit expanded from 2011 onward to reach almost 5% of GDP. This is an important source of vulnerability for a country which is about to try and extricate itself from economic integration with its closest neighbours.

CHART-BoP- current account balance as per cent of GDP

Overall, the Tories economic record is far from impressive: stagnant wages and productivity, weak investment and manufacturing, rising household debt, and a large external deficit.

Now, a reasonable response might be that these are long-standing issues with the UK economy and are not the fault of the Conservatives. There is some truth to this. But if this is the case, Theresa May should identify and acknowledge these issues and provide a clear outline of how her policies will address them. This is not what she has done. Instead, she simply repeats her mantra that only the Conservatives will deliver on the economy, without providing any evidence to support her claim.

And then there is the decision to call a referendum on Brexit. It is hard to think of a more economically reckless move. Household analogies for government economic policy should be avoided — but I can’t think of an alternative in this case.

Following up on an austerity programme with the Brexit referendum is like sending the children to school without lunch money for six years and allowing the house to fall into serious disrepair in order to needlessly over-pay a zero-interest mortgage — and then gambling the house on a dice game.

Given this record, it is astonishing that the Conservatives present themselves, with a straight face, as the party of economic competence — and the media dutifully echoes the message. The truth is that the Conservatives have mismanaged the economy for the last seven years, needlessly imposing austerity, choking off growth in productivity, wages and incomes. They then called an entirely unnecessary referendum, gambling the future prosperity of the country for political gain.

Theresa May is correct — there is little doubt about the economic credibility of the Conservatives. It is in short supply.