Rob Calvert Jump and Jo Michell
Just over a year ago, ahead of Jeremy Hunt’s first Autumn Statement, we published a report on how UK public finances are managed and discussed. At the time, the media was awash with claims of a ‘black hole’ in the public finances. We pointed out that this was incoherent because the so-called black hole was nothing more than the difference between an arbitrary fiscal rule and an uncertain forecast.
We also pointed out that forecasts of public debt are highly sensitive to the assumed path of variables such as nominal GDP growth. The latest Autumn Statement and its accompanying OBR projections provide a case in point.
In the run up to the Statement, the media focus had switched from black holes to ‘fiscal headroom‘. This was reported to be around £20bn, and is a measure of the size of the fall in the public debt in the fifth year of the OBR’s forecast – a ‘black hole’ with the sign reversed.
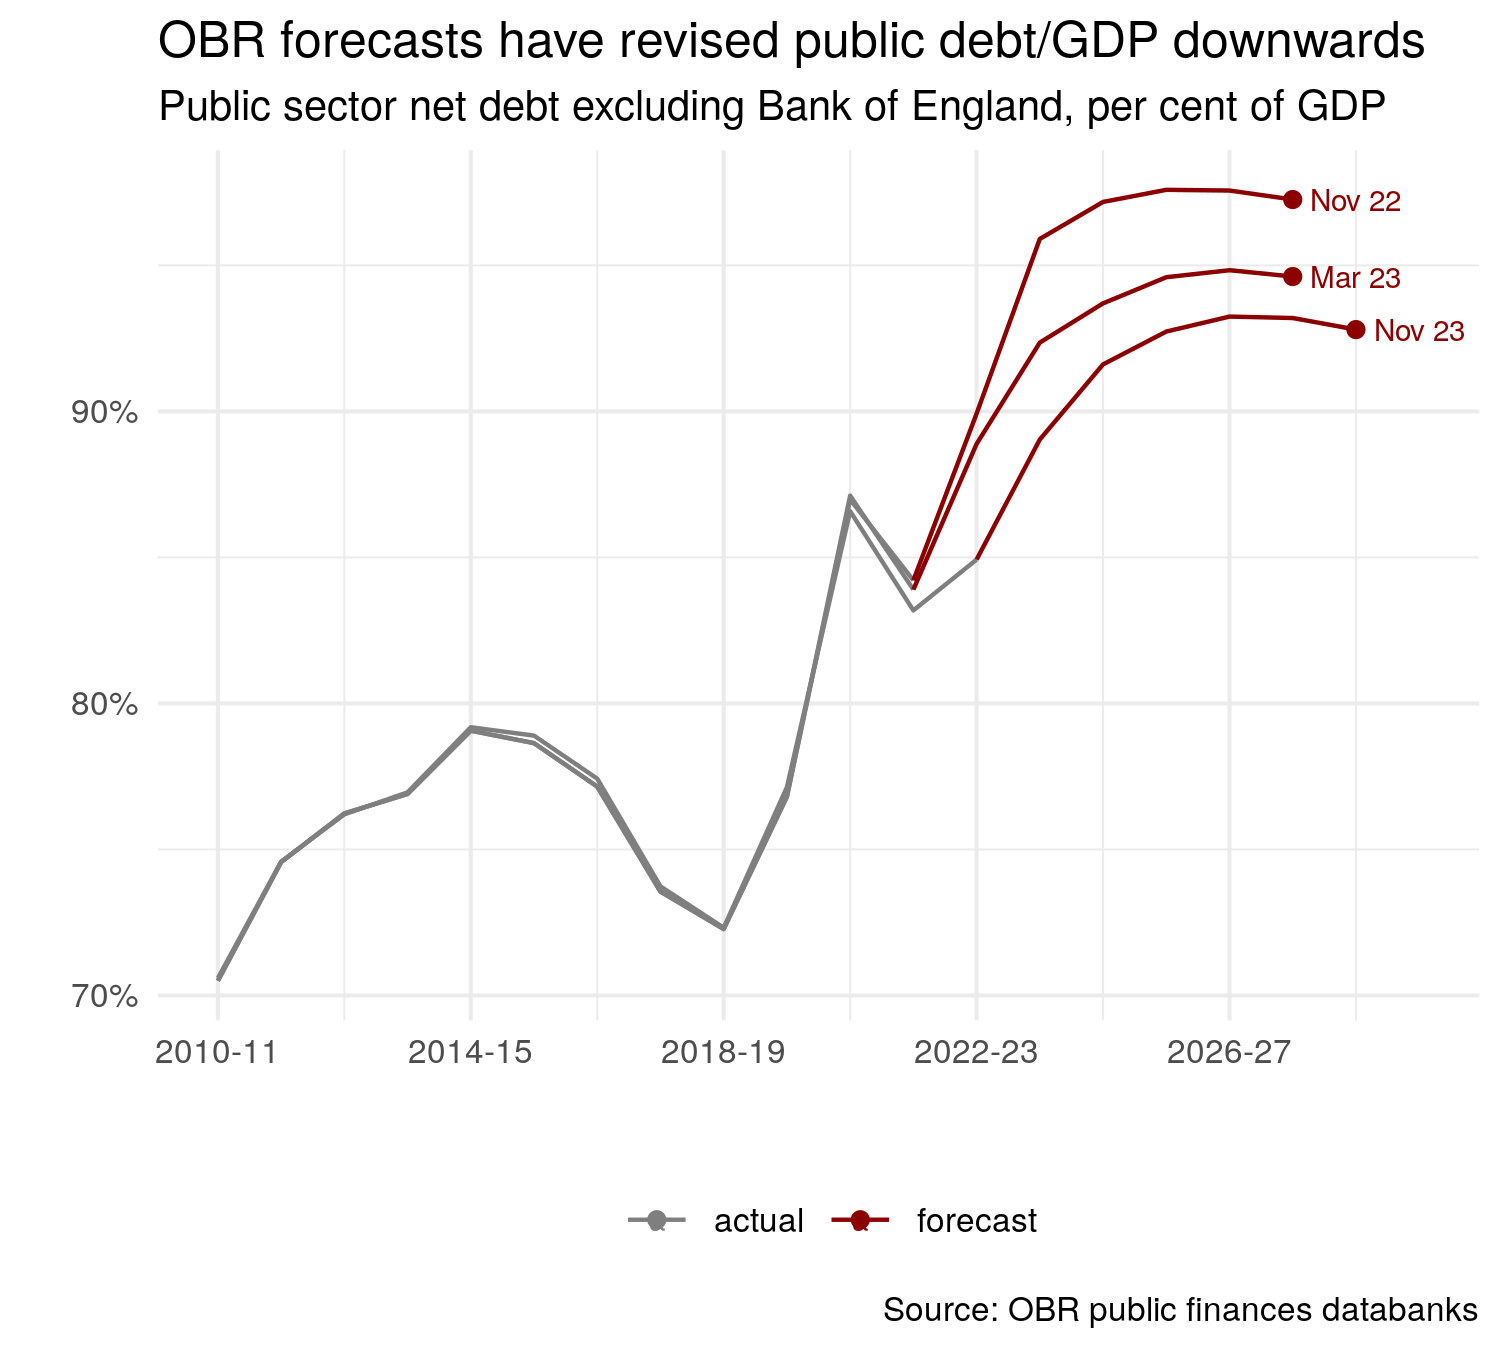
The figure below shows the last three forecasts of public debt from the OBR, along with the historical data published at the time of the forecast. Since the Autumn Statement a year ago, the level of public debt in the final year of the forecasts has fallen from 97.3% of GDP in the November 2022 forecast, to 92.8% of GDP in the most recent one. This forecast revision amounts to nearly £150bn of 2028-29 GDP.
Is this £150bn improvement in the forecast the result of policy actions taken by the government? And if so, why is all the talk of £20bn of headroom, rather than £150bn? The answer to the first question is a firm ‘no’. These shifts in the forecast have nothing to do with policy, and are driven entirely by data revisions and changes in the OBR’s macroeconomic forecasts.
Recent revisions to GDP have shown a stronger recovery from the pandemic than previously thought, alongside higher than expected inflation. As a result, nominal GDP is substantially higher than it was a year ago, and so the debt to GDP ratio is lower.
In the space of a year, data revisions and revised expectations about inflation have, therefore, swamped any change in the debt level driven by policy. Shifts in the positions of the series are far greater than the marginal change between the final two data points – the so-called ‘headroom’ which receives so much attention.
What about the second question? Why are we not talking about £150bn of headroom? The answer to this is unclear, but it is probably the case that the Chancellor of the Exchequer is not actively considering every possible trajectory for the public debt that satisfies his fiscal rules. If he did so, he could substantially increase public spending in a manner that would leave debt falling, as a percentage of GDP, by the end of the OBR’s forecast period.
Consider, for example, the OBR’s November 2023 forecasts for the main fiscal aggregates, displayed in the table below. Public sector net debt, as a percentage of GDP, falls from 93.2% in 2027-28 to 92.8% in 2028-29. Public sector net borrowing is less than 3% of GDP in 2028-29. As a result, the government’s two fiscal targets are met.
| year | gdp | gdp_centred | psnd | psnb | gilt_rate | psnd_pct | psnb_pct |
| 2022-23 | 2552 | 2650 | 2251 | 128.3 | 3.13 | 84.94 | 5.03 |
| 2023-24 | 2726 | 2761 | 2458 | 123.9 | 4.5 | 89.03 | 4.55 |
| 2024-25 | 2798 | 2841 | 2603 | 84.6 | 4.52 | 91.62 | 3.02 |
| 2025-26 | 2887 | 2938 | 2724 | 76.8 | 4.55 | 92.72 | 2.66 |
| 2026-27 | 2995 | 3051 | 2845 | 68.4 | 4.62 | 93.25 | 2.28 |
| 2027-28 | 3106 | 3162 | 2947 | 49.1 | 4.74 | 93.2 | 1.58 |
| 2028-29 | 3218 | 3274 | 3039 | 35.0 | 4.88 | 92.82 | 1.09 |
Now, consider a counterfactual increase in public investment, by £10bn in 2024-25, £15bn in 2025-26, £20bn in 2026-27, £28bn in 2027-28, and then £10bn in 2028-29. This looks something like the Labour Party’s proposed green new deal, in which annual public investment would increase to £28bn over a single parliament. For simplicity we assume multipliers of zero and no impact on inflation, so that nominal GDP is unchanged from the OBR forecasts.
How would this affect public sector borrowing? In 2024-25, it would increase (relative to the OBR’s baseline forecast in table 1) by £10bn. In 2025-26 it would increase by £15bn plus interest payments on the previous year’s £10bn. In 2026-27 it would increase by a further £20bn, plus interest payments on the previous two years’ borrowing, and so on. The resulting time paths for borrowing and debt are displayed in table 2, below.
| year | gdp | gdp_centred | psnd | psnb | gilt_rate | psnd_pct | psnb_pct |
| 2022-23 | 2552 | 2650 | 2251 | 128.3 | 3.13 | 84.94 | 5.03 |
| 2023-24 | 2726 | 2761 | 2458 | 123.9 | 4.5 | 89.03 | 4.55 |
| 2024-25 | 2798 | 2841 | 2613 | 94.6 | 4.52 | 91.97 | 3.38 |
| 2025-26 | 2887 | 2938 | 2749.46 | 92.26 | 4.55 | 93.58 | 3.2 |
| 2026-27 | 2995 | 3051 | 2891.63 | 89.58 | 4.62 | 94.78 | 2.99 |
| 2027-28 | 3106 | 3162 | 3023.84 | 79.31 | 4.74 | 95.63 | 2.55 |
| 2028-29 | 3218 | 3274 | 3129.59 | 48.75 | 4.88 | 95.59 | 1.51 |
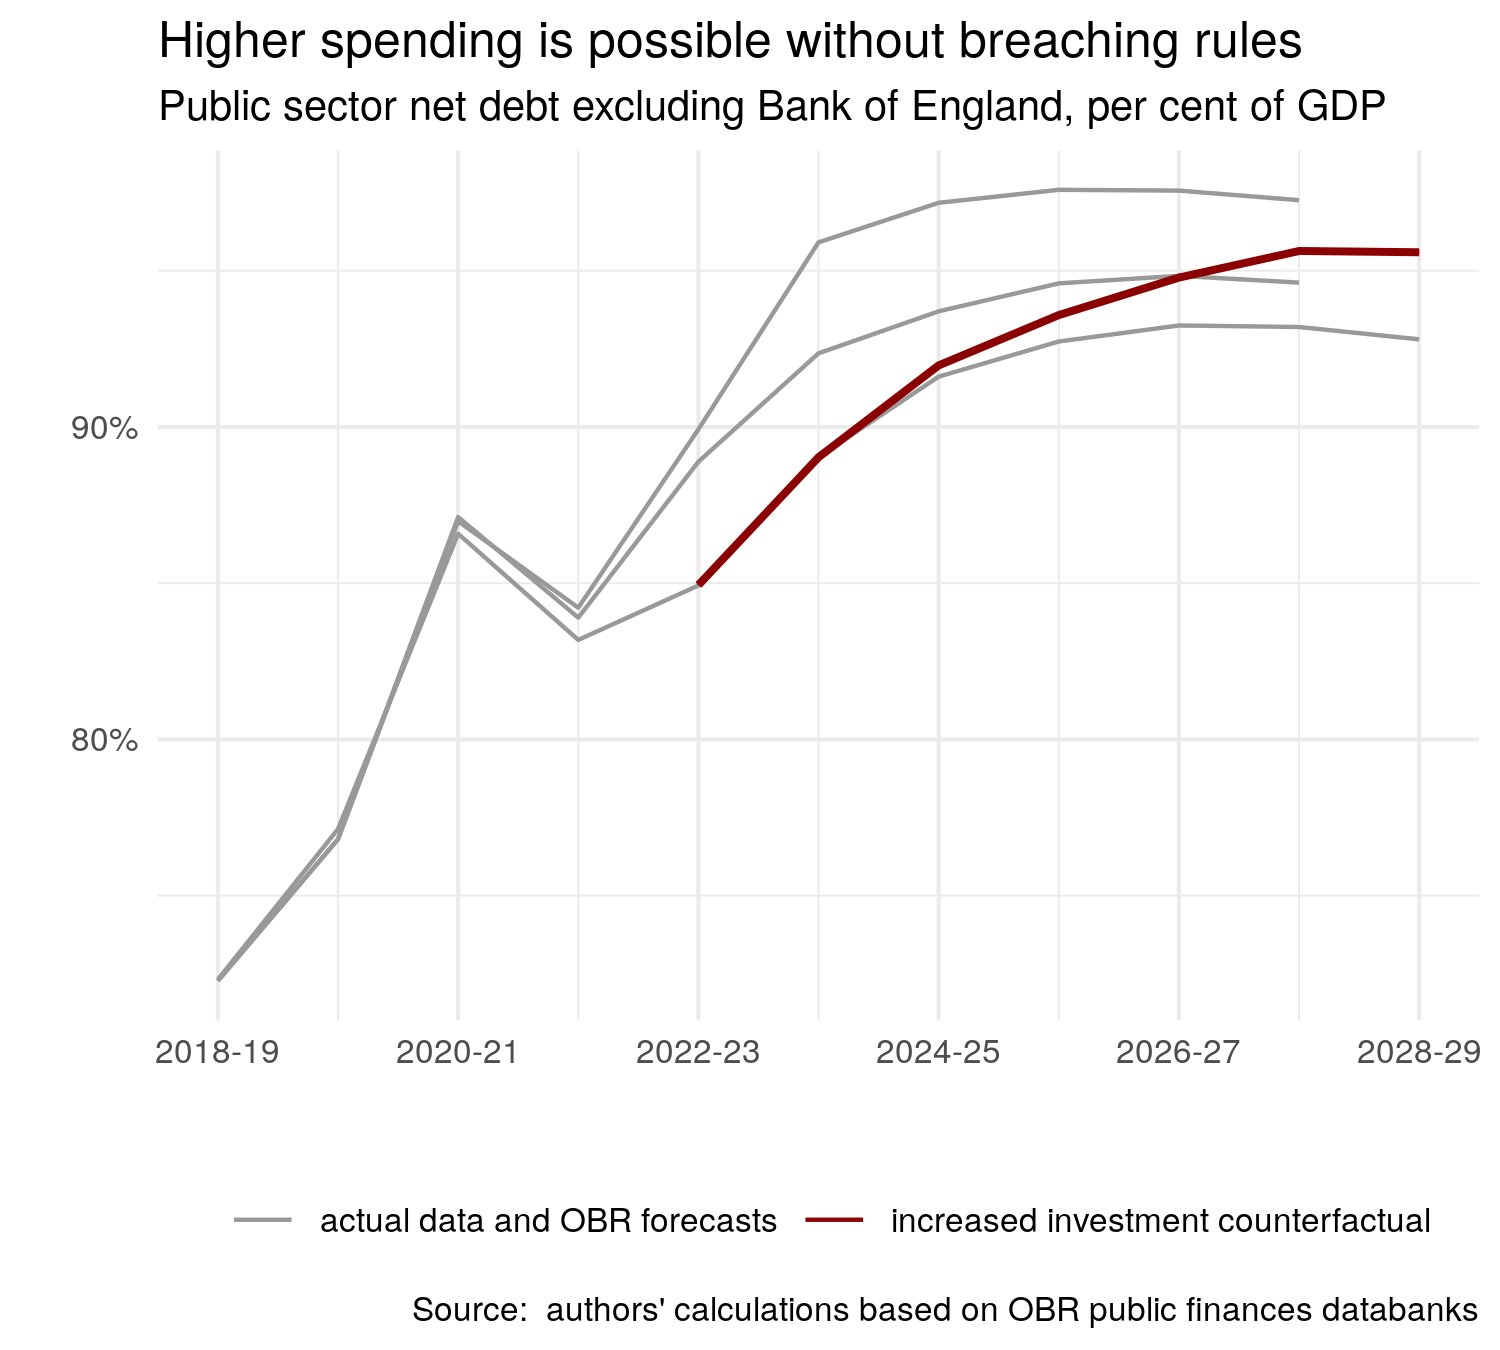
Public sector net debt, as a percentage of GDP, now peaks at a higher level: 95.63% rather than 93.25%. But it is still falling between 2027-28 and 2028-29, and public sector net borrowing is still less than 3% of GDP in 2028-29. As a result, the government’s fiscal targets are still met.
This counterfactual trajectory of debt-to-GDP, alongside the OBR’s recent forecasts are plotted in the figure below. Our counterfactual trajectory is not dissimilar to the OBR’s forecast from March 2023. The end of forecast debt/GDP is around two percentage points of GDP lower than in the November 22 forecast, in which Hunt had defeated the black hole and met his fiscal rules. Given that this was regarded as a success only a year ago, on what basis could our counterfactual trajectory be rejected?
It is clear that ‘headroom’ as reported in the media is not simply a measure of the amount of money that the Chancellor could spend without breaching his fiscal rules. In fact, given its complicated nature, there is no single number that summarises the amount of extra spending consistent with a headline fiscal rule defined by the rate of change of debt-to-GDP at a future point in time. It depends on the distribution of extra spending over the forecast period, as well as the time path of interest rates.
Moreover – and this is, perhaps, more important – it depends on the volatility of the forecasts themselves. The difficulties involved in forecasting economic and fiscal aggregates over a five year horizon is illustrated by pre-budget forecasting exercises published by the Institute of Fiscal Studies and the Resolution Foundation. Their estimates of public debt as a share of GDP at the end of the forecast period differ by nearly 10 percentage points – over £300bn. Minor adjustments to the assumptions that generate these forecasts lead to outcomes an order of magnitude greater than the ‘headroom’ which attracts so much attention.
This is not a rational basis on which to conduct the planning of long-term spending and taxation. It is clear that Hunt’s budget is an exercise in gaming the system. Current nominal tax cuts are ‘paid for’ by creating ‘headroom’ which results from imprecisely specified cuts to government spending towards the end of the forecast period. Moreover, the widely-quoted ‘headroom’ figures have no correspondence whatsoever to the amount of extra money the Chancellor could spend while meeting his rules, and any policy effects are swamped by revisions to the data and forecasts.
As Paul Johnson, head of the Institute for Fiscal studies says, “Aiming for debt to fall in a particular year is not a good fiscal rule”. Simon Wren-Lewis puts it even more bluntly: “falling debt to GDP is a silly rule”.

