G7 growth rates and austerity

Rob Calvert Jump and Jo Michell

In August 2022, revisions to official measures of UK output generated headlines because the new figures implied that the economic contraction during the pandemic was greater than previously thought. 

At the same time, however, substantial revisions were made to historical data, and these received far less attention. One outcome of these revisions is that the UK’s performance relative to other rich economies during the austerity period of 2010–2016 has been downgraded: growth in real GDP per capita over this period is now meaningfully lower. This means that some recent analyses relying on the older figures are misleading.

For example, in a recent FT article, Chris Giles includes data showing that the UK had the highest growth of real GDP per head in the G7 between 2010 and 2016. Inevitably, the article was circulated by defenders of austerity including Rupert Harrison and Tim Pitt, alongside a claim that the data “shows why the idea austerity has caused our growth problems post-GFC doesn’t stack up. During peak austerity (2010-6) UK had strongest GDP per capita growth in G7”.

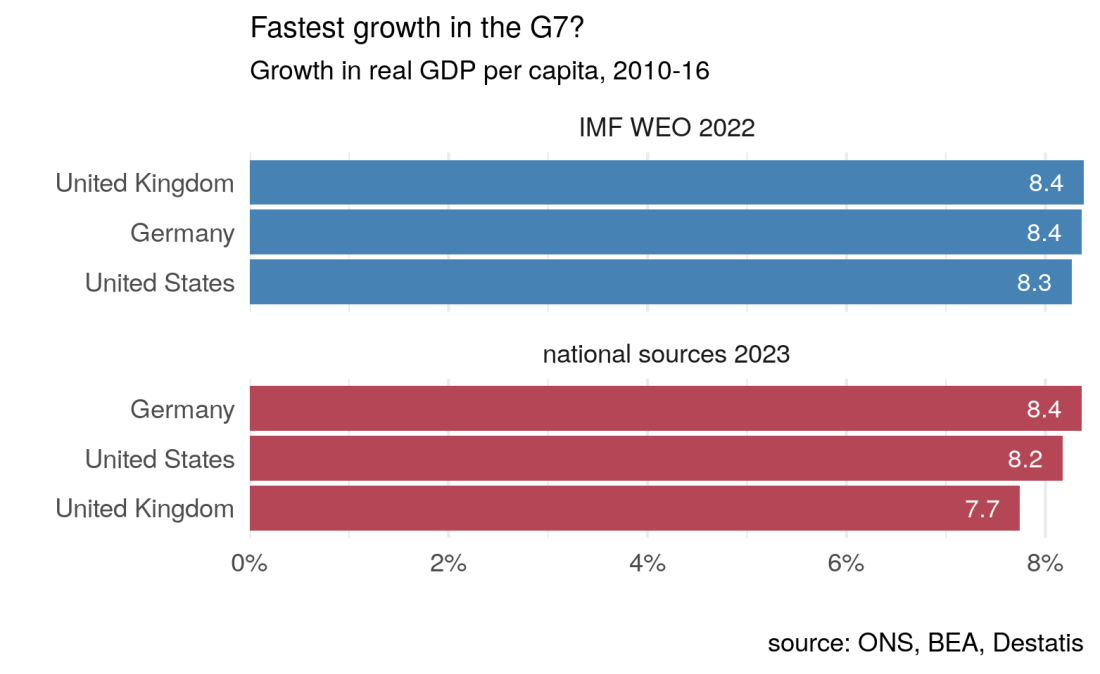
The data used by Chris Giles are from the International Monetary Fund’s (IMF) October 2022 World Economic Outlook (WEO), and show average annual growth in real GDP per head of 1.4% in the UK between 2010 and 2016, compared with 1.3% in both Germany and the USA. But the October 2022 WEO uses data from the 2021 Blue Book, which were compiled before the most recent set of revisions were introduced.

The 2021 data imply that total per capita growth between 2010 and 2016 was 8.39% in the UK, compared with 8.36% in Germany and 8.27% in the USA. On these numbers, the UK is indeed the highest, albeit by a margin in the second decimal place: under a billion pounds separates the UK and Germany. (This very slim margin appears larger in the FT chart due to growth rates being annualised and then rounded to 1 decimal place, implying UK growth of 8.7% versus German growth of 8.1%, a difference of 0.6 percentage points rather than the actual difference in the IMF data of 0.03 percentage points.)

However, according to the revised figures, real per capita growth in the UK over this period was only 7.7%: total nominal GDP growth between 2010 and 2016 was revised down by around one percentage point in the 2022 data, culminating in lower cash GDP of around £17 billion by 2016.  Smaller adjustments to inflation estimates mean that real GDP growth was revised down by around 0.7 percentage points, from 13.4% to 12.7%. Alongside unchanged population estimates, the result is that official real GDP per capita was revised down by around £340 (in 2019 prices) by 2016 – an amount approximately equal to a third of the average household energy bill in that year.

Chart showing downward revisions to UK nominal GDP growth between 2011 and 2016

These revisions are summarised by the ONS here, and their sources are discussed here. The bulk of the revisions are due to the contribution of the insurance industry to GDP being revised down by the use of Solvency II regulatory data, as well as improvements to the way pension schemes are measured. In addition, and of particular relevance for the current exercise, part of the revisions are due to the ONS, “bringing through a package of sources and methods changes that improve the international comparability of the UK gross domestic product (GDP) estimates.” 

These revisions make a material difference to UK GDP, as well as its international ranking. On the basis of the latest official figures taken directly from national statistical agencies, real UK per capita growth of 7.7% during the austerity period compares with 8.4% for Germany and 8.2% for the US.

Chart comparing growth rates in US, UK and Germany between 2010 and 2016.

So, based on the most recent data, the UK did not have the fastest growth in GDP per capita between 2010 and 2016. 

Aside from this, as others have noted, focusing narrowly on the 2010-2016 period is potentially misleading. When austerity was implemented, the UK was in the process of recovering from the 2008 recession. It is likely that there was substantial spare capacity which, under strong demand conditions, could have been quickly reabsorbed into economic activity. If we start our comparison at the pre-crisis peak (2007 for the UK and US, 2008 for Germany), rather than 2010, the divergence is much greater: by 2016, real UK GDP per capita had increased by 2.8% on its pre-crisis level, compared with 5.5% for the US and 7.1% for Germany. Much of UK growth during between 2010 and 2016 was recovering losses from the recession: GDP per capita did not reach pre-2008 levels until 2014, compared to 2011 for Germany and 2012 for the US.

As Chris Giles notes, “Most economists now accept that the sharp reductions in public spending between 2010 and 2015 delayed the recovery from the financial crisis”. Comparing outcomes with pre-crisis levels is not, therefore, “baseline bingo” as claimed by Rupert Harrison. These outcomes are hard to square with Harrison’s claim that this is “what catch up looks like”.

Chart showing real GDP per capita between 2007 and 2016 in US, UK and Germany

These data revisions highlight the dangers in drawing strong conclusions – particularly about politically loaded topics – from small differences in data that are subject to measurement error and revision. It is inevitable that an FT article claiming that UK growth per head was highest in the G7 during the main austerity years will be used as justification for austerity policies. But, on the basis of the most recent and accurate data available, the claim is false. UK GDP growth was relatively strong by international standards (and may yet be revised back to the top of the table) but this statement ought to be placed in its proper context, using a variety of data sources and an understanding of their strengths and weaknesses.

Nominal GDP (YBHA)Real GDP (ABMI)
Year2021 Blue Book2022 Blue Book2021 Blue Book2022 Blue BookIMF 2022 WEO
20101,612,1951,612,3811,884,5151,876,0581,884,515
20111,669,5091,664,2111,911,9831,896,0871,911,983
20121,721,3551,713,2411,940,0871,923,5511,940,087
20131,793,1551,782,2961,976,7551,958,5571,976,755
20141,876,1621,862,8272,035,8832,021,2252,035,883
20151,935,2121,920,9982,089,2762,069,5952,089,276
20162,016,6381,999,4612,136,5662,114,4062,136,566

Data are in millions of pounds (2019 pounds for the real data). Data downloaded from ONS and IMF websites on 20th March 2023. Note that the 2022 Blue Book dataset was only published on the 31st October 2022, too late for inclusion in the IMF’s October 2022 World Economic Outlook. The revisions were initially introduced (and reported on) in August 2022, the quarter before the Blue Book publication.

Fiscal silly season

We are entering fiscal silly season. As the budget approaches, we should brace for impact with breathless reporting of context-free statistics about inflation, interest rates and government debt.

The story is likely to go something like this. Inflation is rising. This raises costs on government debt because some of it (index-linked bonds) pays an interest rate linked to inflation. Costs associated with quantitative easing (QE) will also increase because QE is financed by central bank reserves which pay Bank Rate (the Bank of England’s policy rate of interest). Since inflation is rising the Bank will have to raise interest rates to control it. This will increase the financing costs of QE and the cost of issuing new debt for the Treasury.

The conclusion — sometimes implied, sometimes explicit — is usually some version of “the situation is unsustainable therefore the government will have to make cuts”.

While each part of the story is technically correct in isolation, the overall narrative — debt is out of control and the situation is going to get worse because of inflation — doesn’t stand up to scrutiny.

These stories are rarely presented with sufficient context. Instead, journalists tend to rely on statistical soundbites such as “public debt is the highest since … ”. This is rarely if ever accompanied by the fact that debt/GDP is a fairly meaningless number.

The problems associated with government debt essentially boil down to the fact that debt involves redistribution. In the case of the government this means redistribution in the form of transfers from tax payers to bond holders. This is politically difficult. (This is also why “but currency issuer …” responses to these issues are largely beside the point — the problems of debt management are ultimately political not technical).

The ratio of debt to GDP tells us very little about the current political difficulties arising from debt servicing. Instead, the relevant magnitudes are total interest payments and tax revenues.

Total interest payments are equal to the debt stock multiplied by the effective interest rate on government debt. Focusing on the debt stock in isolation is thus equivalent to representing the area of a rectangle by the length of one side.

A better indicator of the risks associated with public debt is the ratio of government interest payments to tax revenues, as plotted in the figure below.

source: macroflow

Interest payments on government debt have indeed risen recently. A spike in June triggered media articles about the highest interest payments on record. In context, such statistics are shown to be meaningless. Interest payment have risen to around 6% of taxation over a four quarter period, compared with all-time lows of about 5.3%. (Calculated on a 12 monthly basis this rises to around 6.5%). It is hard to see signs that the sky is falling.

In fact, this indicator overstates current interest costs. This is because much of the interest paid by the Treasury is paid to the Bank of England which holds a substantial chunk (currently around 37%) of UK government debt as a result of QE (see chart below). Most of this interest is returned directly to the Treasury. Since the start of QE, this has saved the Treasury over £100bn in interest costs.

source: macroflow

Adjusting for this reduction in interest payments produces the figure below: net interest payments sum to around 4.7% of tax revenues over the last four quarters (or 5.2% on a rolling 12 monthly basis).

source: macroflow

What of the dangers ahead? It is true that if inflation rises, then interest costs will rise, all else equal. But the scale of these rises is not predetermined, and will be affected by policy.

First, persistent inflation is far from a certainty. If if inflation does persist in the short term, the Bank does not need to raise interest rates. Hikes in response to price pressures due to pandemic reopening and supply side bottlenecks will do more harm than good — instead the Bank should wait until the economic recovery is clearly underway. In this context, interest rate increases would likely be a good sign, and would be offset by rising tax revenues. Further, the Bank could introduce a “tiered reserve” system which would serve to hold down the rate paid on a substantial proportion of outstanding debt. Short term and index-linked debt can be rolled over at longer maturities, delaying the point at which higher rates would feed into higher interest payments.

In summary, simple claims such as “a one percentage point rise in interest rates and inflation could cost the Treasury about £25bn a year” are not useful without context and explanation of the long list of assumptions required to produce such a figure. The policy conclusions derived from such claims should be taken with a large pinch of salt.

Season’s Greetings and enjoy the festive period!

Should we fear the robots? Automation, productivity and employment

Special session at the British Academy of Management conference

Monday 3 September, 12.30-14.00, Room 2X242

Bristol Business School, UWE, Coldharbour Lane, BS16 1QY

A panel discussion on productivity, automation and employment, with

Frances Coppola, Finance and Economics Writer

Daniel Davies, Investment Banking Analyst

Duncan Weldon, Head of Research, Resolution Group

Chaired by Jo Michell, UWE Bristol.

Since the 2008 crisis, UK productivity has stagnated. At the same time, fears are growing that robots will challenge humans for an ever wider range of jobs. This panel brings together leading economists to discuss these apparently contradictory trends – and what should be done about them.

This is a special session so all are welcome. Conference registration is not required.

The full conference programme can be downloaded here

For more details please contact Jo Michell on jo.michell@uwe.ac.uk


Austerity and household debt: a macro link?

For some time now I’ve been arguing that not only does austerity have real effects but also financial implications.

When the government runs a deficit, it produces a flow supply of safe assets: government bonds. If the desired saving of the private sector exceeds the level of capital investment, it will absorb these assets without government spending inducing inflationary tendencies.

This was the situation in the aftermath of the 2008 crisis. Attempted deleveraging led to increased household saving, reduced spending and lower aggregate demand. Had the government not run a deficit of the size it did, the recession would have been more severe and prolonged.

When the coalition came to power in 2010 and austerity was introduced, the flow supply of safe assets began to contract. What happens if those who want to accumulate financial assets — wealthy households for the most part — are not willing to reduce their saving rate? If there is an unchanged flow demand for financial assets at the same time as the government reduces the supply, what is the result?

Broadly speaking there are two possible outcomes: one is lower demand and output: a recession. If growth is to be maintained, the only option is that some other group must issue a growing volume of financial liabilities, to offset the reduction in supply by the government.

In the UK, since 2010, this group has been households — mostly households on lower incomes. As the government cut spending, incomes fell and public services were rolled back. Unsurprisingly, many households fell back on borrowing to make ends meet.

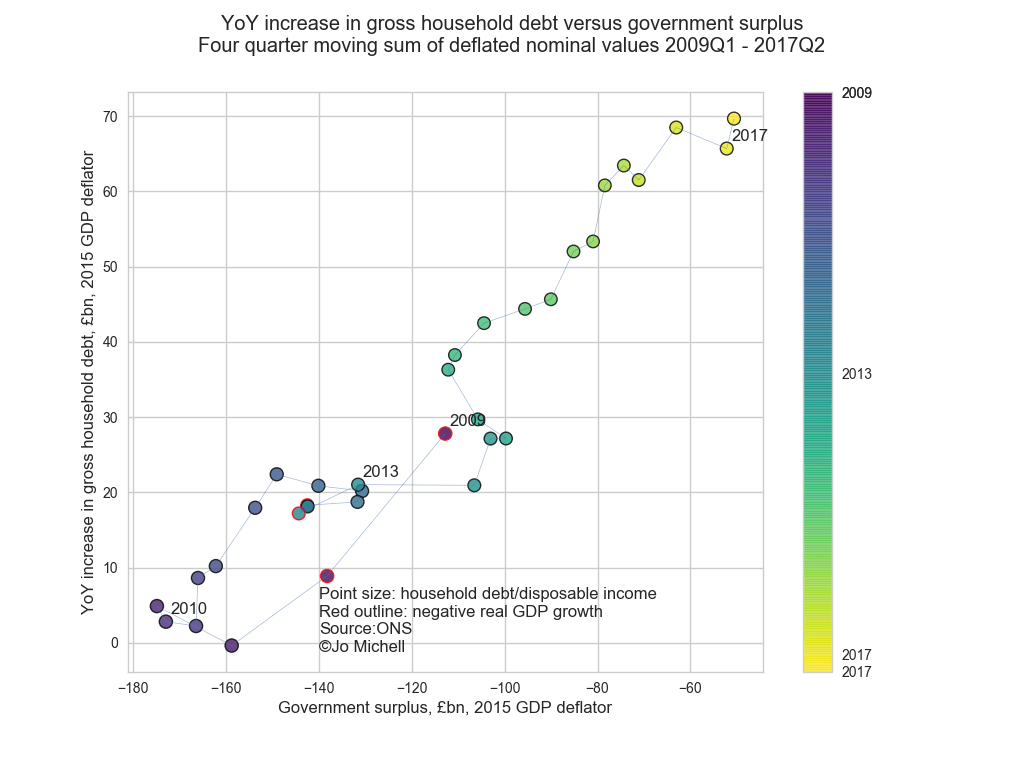
The graph below shows the relationship between the government deficit and the annual increase in gross household debt (both series are four quarter rolling sums deflated to 2015 prices).

hh2

From 2010 onwards, steady reduction in the government deficit was accompanied by a steady increase in the rate of accumulation of household debt. The ratio is surprisingly steady: every £2bn of deficit reduction has been accompanied by an additional £1bn per annum increase in the accumulation of household debt.

Note that this is the rate at which gross household debt is accumulated — not the “net financial balance” of the household sector. The latter is highlighted in discussions of “sectoral balances”, and in particular the accounting requirement that a reduction in the government deficit be accompanied by either an increase in the deficit of the private sector or a reduction in the deficit with the foreign sector.

Critics of the sectoral balances argument make the point that the net financial balance of the household sector is not the relevant indicator. Most household borrowing takes place within the household sector, mediated by the financial system. Savers hold bank deposits and pension fund claims, while other households borrow from the banks. The gross indebtedness of the household sector can therefore either increase or decrease without any change in the net position. Critics therefore see the sectoral balances argument argue as incoherent because it displays a failure to understand basic national accounting. This view has been articulated by Chris Giles and Andrew Lilico, among others.

For the UK, at least, this criticism appears misplaced. The chart below plots four measures of the household sector financial position along with the government deficit. The indicators for the household sector are the net financial balance, gross household debt as a share of both GDP and household disposable income, and the household saving ratio. The correlation between the series is evident.

hh3

The relationship between the government deficit and the change in gross household debt is surprisingly stable. The figure below plots the series for the full period for which data are available from the ONS: from 1987 until 2017. With the exception of the period 2001-2008, where there is a clear structural break, the relationship is persistent.

hh1

Why should this be the case? One needs to be careful with apparently stable relationships between macroeconomic variables — they have a habit of breaking down. One reason for caution is that the composition of household debt has changed over the period shown: in the pre-2008 period most of the increase was mortgage borrowing, while post-crisis, consumer debt in the form of credit cards, car loans and so on has played an increasing role. Nonetheless, a hypothesis can be advanced:

If one group of households saves a relatively constant share of income — and this represents the majority of total saving in the household sector — then variance in the supply of assets issued by public sector must be matched either by variations in output and employment or by variance in the issuance of financial liabilities by other sectors. If monetary policy is used to maintain steady inflation and therefore relatively stable output and employment, changes in the cost of borrowing may induce other (non-saver) households to adjust their consumption decisions in such a way that stabilises output.

Put another way, if the contribution of government deficit spending to total demand varies and saving among some households is relatively inelastic, avoiding recessions requires another sector (or sub-sector) to go into deficit in order that total demand be maintained.

This hypothesis fits with the observation that the household saving ratio falls as the rate of gross debt accumulation increases. Paradoxically, the problem is not too little household saving but too much, given the volume of investment. If inelastic savers were willing to reduce their saving and increase consumption in response to lower government spending, then recession could be avoided without an increase in household debt. A better solution would be an increase in the business investment of the private sector: it is the difference between saving and investment that matters.

There is a clear structural break in the relationship between the deficit and household debt, starting around 2001. This is likely the result of the global credit boom which gathered pace after Alan Greenspan cut the target federal funds rate from 6.5% in 1999 to 1% in 2001. During this period, the financial position of the corporate sector shifted from deficit to surplus, matched by large rises in the accumulation of household debt. With the outbreak of crisis in 2008, the previous relationship appears to re-emerge.

Careful econometrics work is required to try and disentangle the drivers of rising household debt. But relationships between macroeconomic variables with this degree of stability are unusual. Something interesting is going on here.

EDIT: 22 November

Toby Nangle left a comment suggesting that it would be good to show the data on borrowing by different income levels. It’s a good point, and raises a complex issue about the distribution of lending and borrowing within the household sector. This is something that J. W. Mason and others have been discussing. I need another post to fully explain my thinking on this, but for now, I’ll include the following graph:

hh4

This is calculated using an experimental new dataset compiled by the ONS which uses micro data source to try and produce disaggregated macro datasets. Data are currently only available for three years — 2008, 2012, and 2013 — but I understand that the ONS are working on a more complete dataset.

What this shows is that in 2008, at the end of the 2000s credit boom, only the top two income quintiles were saving: the bottom 60% of the population was dissaving. In 2012 and 2013, the household saving ratio and financial balance had increased substantially and this shows up in the disaggregated figures as positive saving for all but the bottom quintile.

I suspect that as the saving ratio and net financial balance have subsequently declined, and gross debt has increased, the distributional pattern is reverting to what it looked like in 2008: saving at the top of the income distribution and dissaving in the lower quintiles.

Thoughts on the NAIRU

Simon Wren-Lewis’s post attacking Matthew Klein’s critique of the NAIRU provoked some strong reactions. On reflection, my initial response was wide of the mark. Matthew responded saying he agreed with most of Simon’s piece.

So are we all in agreement? I think there are differences, but we need to first clarify the issues.

Matthew’s main point was empirical: if you want to use a relationship between employment and inflation as a policy target it needs to be relatively stable. The evidence suggests it is not.

But there is a deeper question of what the NAIRU actually means – what is a NAIRU? The simple definition is straightforward: it is the rate of unemployment at which inflation is stable. If policy is used to increase demand, reducing unemployment below the NAIRU, inflation will rise until excess demand is removed and unemployment allowed to increase again.

At first glance this appears all but identical to the ‘natural rate of unemployment’, a concept originating with Friedman’s monetarism and inherited by some New Keynesian models – in particular the ‘standard’ sticky-price DSGE model of Woodford and others. In this view, the economy has ‘natural rates’ of output and employment, beyond which any attempt by policy makers to increase demand becomes futile, leading only to ever-higher inflation. Since there is a direct correspondence between stabilizing inflation and fixing output and employment at their ‘natural’ rates, policy makers should simply adjust interest rates to hit an inflation target. In typically modest fashion, economists refer to this as the ‘Divine Coincidence‘ – despite the fact it is essentially imposed on the models by assumption.

Matthew’s piece skips over this part of the history, jumping straight from Bill Phillips’s empirical relationship to the NAIRU. But the NAIRU is a weaker claim than the natural rate. As Simon says, all that is required for a NAIRU is a relationship of the form inf = f(U, E[inf]), i.e. current inflation is some function of unemployment and expected inflation. At its simplest, agents could just assume inflation will be the same in the current period as the last period. Then, employment above some level would causing rising inflation and vice versa.

More sophisticated New Keynesian formulations of the NAIRU are a good distance removed from the ‘natural rate’ theory – these models include imperfections in the labour and product markets and a bargaining process between workers and firms. As a result, they incorporate (at least short-run) involuntary unemployment and see inflation as driven by competing claims on output rather than the ‘too much nominal demand chasing too few goods’ story of the monetarists and simple DSGE models.

It is also the case that such a relationship is found in many heterodox models. Engelbert Stockhammer explores heterodox views on the NAIRU in a provocatively-titled paper, ‘Is the NAIRU Theory a Monetarist, New Keynesian, Post Keynesian or Marxist Theory?’. He doesn’t identify a clear heterodox position – some Post-Keynesians reject the NAIRU outright, while others present models which incorporate NAIRU-like relationships.

Engelbert notes that arguably the earliest definition of the NAIRU is to be found in Joan Robinson’s 1937 Essays in the Theory of Employment:

In any given conditions of the labour market there is a certain more or less definite level of employment at which money wages will rise … there is a certain level of employment, determined by the general strategical position of the Trade Unions, at which money wages rise, and at that level of employment there is a certain level of real wages, determined by the technical conditions of production and the degree of monopoly’ (Robinson, 1937, pp. 4-5)

Recent Post-Keynesian models also include NAIRU-like relationships. For example, Godley and Lavoie’s textbook includes a model in which workers and firms compete by attempting to impose money-wage and price increases respectively. The size of wage increases demanded by workers is a function of the employment rate relative to some ‘full employment’ level. That sounds a lot like a NAIRU – but that isn’t how Godley and Lavoie see it:

Inflation under these assumptions does not necessarily accelerate if employment stays in excess of its ‘full employment’ level. Everything depends on the parameters and whether they change … An implication of the story proposed here is that there is no vertical long-run Phillips curve. There is no NAIRU. (Godley and Lavoie, 2007, p. 304, my emphasis)

The authors summarise their view with a quote from an earlier work by Godley:

Indeed if it is true that there is a unique NAIRU, that really is the end of discussion of macroeconomic policy. At present I happen not to believe it and that there is no evidence of it. And I am prepared to express the value judgment that moderately higher inflation rates are an acceptable price to pay for lower unemployment. But I do not accept that it is a foregone conclusion that inflation will be higher if unemployment is lower (Godley 1983: 170, my emphasis).

This highlights a key difference between Post-Keynesian and neoclassical approaches to the NAIRU: where Post-Keynesian models do include NAIRU-like relationships, the relevent employment level is endogenous, due to hysteresis effects for example. In other words, the NAIRU moves around and is influenced by demand-management policy. As such, the NAIRU is not an attractor for the unemployment rate as in many neoclassical models.

Marxist theory also contains something which looks a lot like a NAIRU: the ‘industrial reserve army’ of the unemployed. Marx argued that unemployment is the mechanism by which capitalists discipline workers and prevent wage claims rising to the point at which profits and capital accumulation are depleted. Periodic recessions are therefore a necessary part of the capitalist development process.

This led Nicholas Kaldor to describe Margaret Thatcher as ‘our first Marxist Prime Minister’ – not because she was an advocate of socialist revolution but because she understood the reserve army mechanism: ‘They have managed to create a pool – or a “reserve army” as Marx would have called it – of 3 million unemployed … the British working classes have been thoroughly cowed and frightened.’ (This point is passed over rather quickly in Simon’s piece. In the 1980s, he writes, ‘policy changed and increased unemployment and inflation fell.’)

So we should be careful about blanket dismissals of the NAIRU. Instead, we must be clear how our analysis differs: what are the mechanisms which generate inflationary pressure at low levels of unemployment – conflicting claims or excess nominal demand? Is the NAIRU stable and exogenous? Does it act as an attractor for the unemployment rate, and over what time period? What are the implications for policy?

Ultimately, I think this breaks down into an issue about semantics. How far from the unique, stable, vertical long-run Phillips curve can we get and still have something we call a NAIRU? Simon adopts a very loose definition:

There is a relationship between inflation and unemployment, but it is just very difficult to pin down. For most macroeconomists, the concept of the NAIRU really just stands for that basic macroeconomic truth.

I’d like to believe this were true. But I suspect most macroeconomists, trained on New Keynesian DSGE models, have a narrower view: they tend to think in terms of a stable short-run sticky-price Phillips curve and a unique long-run Phillips curve at the ‘natural’ rate of employment.

There is one other aspect to consider. Engelbert Stockhammer distinguishes between the New Keynesian NAIRU theory and the New Keynesian NAIRU story. He argues (writing in 2007, just before the crisis) that the NAIRU has been used as the basis for an account of unemployment which blames inflexible labour markets, over-generous welfare states, job protection measures and strong unions. The policy prescriptions are then straightforward: labour markets should be deregulated and welfare states scaled back. Demand management should not be used to reduce unemployment.

While economists have changed their tune substantially in the decade since the financial crisis, I suspect that the NAIRU story is one reason that defence of the NAIRU theory generates such strong reactions.

EDIT: Bruno Bonizzi points me to this piece at the INET blog with has an excellent discussion of the empirical evidence and theoretical implications of hysteresis effects and an unstable NAIRU.


Image reproduced from Wikipedia: https://en.wikipedia.org/wiki/File:NAIRU-SR-and-LR.svg

Economics, Ideology and Trump

So the post-mortem begins. Much electronic ink has already been spilled and predictable fault lines have emerged. Debate rages in particular on the question of whether Trump’s victory was driven by economic factors. Like Duncan Weldon, I think Torsten Bell gets it about right – economics is an essential part of the story even if the complete picture is more complex.

Neoliberalism is a word I usually try to avoid. It’s often used by people on the left as an easy catch-all to avoid engaging with difficult issues. Broadly speaking, however, it provides a short-hand for the policy status quo over the last thirty years or so: free movement of goods, labour and capital, fiscal conservatism, rules-based monetary policy, deregulated finance and a preference for supply-side measures in the labour market.

Some will argue this consensus has nothing to with the rise of far-right populism. I disagree. Both economics and economic policy have brought us here.

But to what extent has academic economics provided the basis for neoliberal policy? The question had been in my mind even before the Trump and Brexit votes. A few months back, Duncan Weldon posed the question, ‘whatever happened to deficit bias?’ In my view, the responses at the time missed the mark. More recently, Ann Pettifor and Simon Wren Lewis have been discussing the relationship between ideology, economics and fiscal austerity.

I have great respect for Simon – especially his efforts to combat the false media narratives around austerity. But I don’t think he gets it right on economics and ideology. His argument is that in a standard model – a sticky-price DSGE system – fiscal policy should be used when nominal rates are at the zero lower bound. Post-2008 austerity policies are therefore at odds with the academic consensus.

This is correct in simple terms, but I think misses the bigger picture of what academic economics has been saying for the last 30 years. To explain, I need to recap some history.

Fiscal policy as a macroeconomic management tool is associated with the ideas of Keynes. Against the academic consensus of his day, he argued that the economy could get stuck in periods of demand deficiency characterised by persistent involuntary unemployment. The monetarist counter-attack was led by Milton Friedman – who denied this possibility. In the long run, he argued, the economy has a ‘natural’ rate of unemployment to which it will gravitate automatically (the mechanism still remains to be explained). Any attempt to use activist fiscal or monetary policy to reduce unemployment below this natural rate will only lead to higher inflation. This led to the bitter disputes of the 1960s and 70s between Keynesians and Monetarists. The Monetarists emerged as victors – at least in the eyes of the orthodoxy – with the inflationary crises of the 1970s. This marks the beginning of the end for fiscal policy in the history of macroeconomics.

In Friedman’s world, short-term macro policy could be justified in a deflationary situation as a way to help the economy back to its ‘natural’ state. But, for Friedman, macro policy means monetary policy. In line with the doctrine that the consumer always knows best, government spending was proscribed as distortionary and inefficient. For Friedman, the correct policy response to deflation is a temporary increase in the rate of growth of the money supply.

It’s hard to view Milton Friedman’s campaign against Keynes as disconnected from ideological influence. Friedman’s role in the Mont Pelerin society is well documented. This group of economic liberals, led by Friedrich von Hayek, formed after World War II with the purpose of opposing the move towards collectivism of which Keynes was a leading figure. For a time at least, the group adopted the term ‘neoliberal’ to describe their political philosophy. This was an international group of economists whose express purpose was to influence politics and politicians – and they were successful.

Hayek’s thesis – which acquires a certain irony in light of Trump’s ascent – was that collectivism inevitably leads to authoritarianism and fascism. Friedman’s Chicago economics department formed one point in a triangular alliance with Lionel Robbins’ LSE in London, and Hayek’s fellow Austrians in Vienna. While in the 1930s, Friedman had expressed support for the New Deal, by the 1950s he had swung sharply in the direction of economic liberalism. As Brad Delong puts it:

by the early 1950s, his respect for even the possibility of government action was gone. His grudging approval of the New Deal was gone, too: Those elements that weren’t positively destructive were ineffective, diverting attention from what Friedman now believed would have cured the Great Depression, a substantial expansion of the money supply. The New Deal, Friedman concluded, had been ‘the wrong cure for the wrong disease.’

While Friedman never produced a complete formal model to describe his macroeconomic vision, his successor at Chicago, Robert Lucas did – the New Classical model. (He also successfully destroyed the Keynesian structural econometric modelling tradition with his ‘Lucas critique’.) Lucas’ New Classical colleagues followed in his footsteps, constructing an even more extreme version of the model: the so-called Real Business Cycle model. This simply assumes a world in which all markets work perfectly all of the time, and the single infinitely lived representative agent, on average, correctly predicts the future.

This is the origin of the ‘policy ineffectiveness hypothesis’ – in such a world, government becomes completely impotent. Any attempt at deficit spending will be exactly matched by a corresponding reduction in private spending – the so-called Ricardian Equivalence hypothesis. Fiscal policy has no effect on output and employment. Even monetary policy becomes totally ineffective: if the central bank chooses to loosen monetary policy, the representative agent instantly and correctly predicts higher inflation and adjusts her behaviour accordingly.

This vision, emerging from a leading centre of conservative thought, is still regarded by the academic economics community as a major scientific step forward. Simon describes it as `a progressive research programme’.

What does all this have to with the current status quo? The answer is that this model – with one single modification – is the ‘standard model’ which Simon and others point to when they argue that economics has no ideological bias. The modification is that prices in the goods market are slow to adjust to changes in demand. As a result, Milton Friedman’s result that policy is effective in the short run is restored. The only substantial difference to Friedman’s model is that the policy tool is the rate of interest, not the money supply. In a deflationary situation, the central bank should cut the nominal interest rate to raise demand and assist the automatic but sluggish transition back to the `natural’ rate of unemployment.

So what of Duncan’s question: what happened to deficit bias? – this refers to the assertion in economics textbooks that there will always be a tendency for governments to allow deficits to increase. The answer is that it was written out of the textbooks decades ago – because it is simply taken as given that fiscal policy is not the correct tool.

To check this, I went to our university library and looked through a selection of macroeconomics textbooks. Mankiw’s ‘Macroeconomics’ is probably the mostly widely used. I examined the 2007 edition – published just before the financial crisis. The chapter on ‘Stabilisation Policy’ dispenses with fiscal policy in half a page – a case study of Romer’s critique of Keynes is presented under the heading ‘Is the Stabilization of the Economy a Figment of the Data?’ The rest of the chapter focuses on monetary policy: time inconsistency, interest rate rules and central bank independence. The only appearance of the liquidity trap and the zero lower bound is in another half-page box, but fiscal policy doesn’t get a mention.

The post-crisis twelfth edition of Robert Gordon’s textbook does include a chapter on fiscal policy – entitled `The Government Budget, the Government Debt and the Limitations of Fiscal Policy’. While Gordon acknowledges that fiscal policy is an option during strongly deflationary periods when interest rates are at the zero lower bound, most of the chapter is concerned with the crowding out of private investment, the dangers of government debt and the conditions under which governments become insolvent. Of the textbooks I examined, only Blanchard’s contained anything resembling a balanced discussion of fiscal policy.

So, in Duncan’s words, governments are ‘flying a two engined plane but choosing to use only one motor’ not just because of media bias, an ill-informed public and misguided politicians – Simon’s explanation – but because they are doing what the macro textbooks tell them to do.

The reason is that the standard New Keynesian model is not a Keynesian model at all – it is a monetarist model. Aside from the mathematical sophistication, it is all but indistinguishable from Milton Friedman’s ideologically-driven description of the macroeconomy. In particular, Milton Friedman’s prohibition of fiscal policy is retained with – in more recent years – a caveat about the zero-lower bound (Simon makes essentially the same point about fiscal policy here).

It’s therefore odd that when Simon discusses the relationship between ideology and economics he chooses to draw a dividing line between those who use a sticky-price New Keynesian DSGE model and those who use a flexible-price New Classical version. The beliefs of the latter group are, Simon suggests, ideological, while those of the former group are based on ideology-free science. This strikes me as arbitrary. Simon’s justification is that, despite the evidence, the RBC model denies the possibility of involuntary unemployment. But the sticky-price version – which denies any role for inequality, finance, money, banking, liquidity, default, long-run unemployment, the use of fiscal policy away from the ZLB, supply-side hysteresis effects and plenty else besides – is acceptable. He even goes so far as to say ‘I have no problem seeing the RBC model as a flex-price NK model’ – even the RBC model is non-ideological so long as the hierarchical framing is right.

Even Simon’s key distinction – the New Keynesian model allows for involuntary unemployment – is open to question. Keynes’ definition of involuntary unemployment is that there exist people willing and able to work at the going wage who are unable to find employment. On this definition the New Keynesian model falls short – in the face of a short-run demand shortage caused by sticky prices the representative agent simply selects a new optimal labour supply. Workers are never off their labour supply curve. In the Smets Wouters model – a very widely used New Keynesian DSGE model – the labour market is described as follows: ‘household j chooses hours worked Lt(j)’. It is hard to reconcile involuntary unemployment with households choosing how much labour they supply.

What of the position taken by the profession in the wake of 2008? Reinhart and Rogoff’s contribution is by now infamous. Ann also draws attention to the 2010 letter signed by 20 top-ranking economists – including Rogoff – demanding austerity in the UK. Simon argues that Ann overlooks the fact that ‘58 equally notable economists signed a response arguing the 20 were wrong’.

It is difficult to agree that the signatories to the response letter, organised by Lord Skidelsky, are ‘equally notable’. Many are heterodox economists – critics of standard macroeconomics. Those mainstream economists on the list hold positions at lower-ranking institutions than the 20. I know many of the 58 personally – I know none of the 20. Simon notes:

Of course those that signed the first letter, and in particular Ken Rogoff, turned out to be a more prominent voice in the subsequent debate, but that is because he supported what policymakers were doing. He was mostly useful rather than influential.

For Simon, causality is unidirectional: policy-makers cherry-pick academic economics to fit their purpose but economists have no influence on policy. This seems implausible. It is undoubtedly true that pro-austerity economists provided useful cover for small-state ideologues like George Osborne. But the parallels between policy and academia are too strong for the causality to be unidirectional.

Osborne’s small state ideology is a descendent of Thatcherism – the point when neoliberalism first replaced Keynesianism. Is it purely coincidence that the 1980s was also the high-point for extreme free market Chicago economics such as Real Business Cycle models?

The parallel between policy and academia continues with the emergence of the sticky-price New Keynesian version as the ‘standard’ model in the 90s alongside the shift to the third way of Blair and Clinton. Blairism represents a modified, less extreme, version of Thatcherism. The all-out assault on workers and the social safety net was replaced with ‘workfare’ and ‘flexicurity’.

A similar story can be told for international trade, as laid out in this excellent piece by Martin Sandbu. In the 1990s, just as the ‘heyday of global trade integration was getting underway’, economists were busy making the case that globalisation had no negative implications for employment or inequality in rich nations. To do this, they came up with the ‘skill-biased technological change’ (SBTC) hypothesis. This states that as technology advances and the potential for automation grows, the demand for high-skilled labour increases. This introduces the hitch that higher educational standards are required before the gains from automation can be felt by those outside the top income percentiles. This leads to a `race between education and technology’ – a race which technology was winning, leading to weaker demand for middle and low-skill workers and rising ‘skill premiums’ for high skilled workers as a result.

Writing in the Financial Times shortly before the financial crisis, Jagdish Bagwati argued that those who looked to globalisation as an explanation for increasing inequality were misguided:

The culprit is not globalization but labour-saving technical change that puts pressure on the wages of the unskilled. Technical change prompts continual economies in the use of unskilled labour. Much empirical argumentation and evidence exists on this. (FT, January 4, 2007, p. 11)

As Krugman put it:

The hypothesis that technological change, by raising the demand for skill, has led to growing inequality is so widespread that at conferences economists often use the abbreviation SBTC – skill-biased technical change – without explanation, assuming that their listeners know what they are talking about (p. 132)

Over the course of his 2007 book, Krugman sets out on a voyage of discovery – ‘That, more or less, is the story I believed when I began working on this book’ (p. 6). He arrives at the astonishing conclusion – ‘[i]t sounds like economic heresy’ (p. 7) – that politics can influence inequality:

[I]nstitutions, norms and the political environment matter a lot more for the distribution of income – and … impersonal market forces matter less – than Economics 101 might lead you to believe (p. 8)

The idea that rising pay at the top of the scale mainly reflect social and political change, … strikes some people as … too much at odds with Economics 101.

If a left-leaning Nobel prize-winning economist has trouble escaping from the confines of Economics 101, what hope for the less sophisticated mind?

As deindustrialisation rolled through the advanced economies, wiping out jobs and communities, economists continued to deny any role for globalisation. As Martin Sandbu argues,

The blithe unconcern displayed by the economics profession and the political elites about whether trade was causing deindustrialisation, social exclusion and rising inequality has begun to seem Pollyannish at best, malicious at worst. Kevin O’Rourke, the Irish economist, and before him Lawrence Summers, former US Treasury Secretary, have called this “the Davos lie.”

For mainstream macroeconomists, inequality was not a subject of any real interest. While the explanation for inequality lay in the microeconomics – the technical forms of production functions – and would be solved by increasing educational attainment, in macroeconomic terms, the use of a representative agent and an aggregate production function simply assumed the problem away. As Stiglitz puts it:

[I]f the distribution of income (say between labor and capital) matters, for example, for aggregate demand and therefore for employment and output, then using an aggregate Cobb-Douglas production function which, with competition, implies that the share of labor is fixed, is not going to be helpful. (p.596)

Robert Lucas summed up his position as follows: ‘Of the tendencies that are harmful to sound economics, the most seductive, and in my opinion the most poisonous, is to focus on questions of distribution.’ It is hard to view this statement as informed more strongly by science than ideology.

But while economists were busy assuming away inequality in their models, incomes continued to diverge in most advanced economies. It was only with the publication of Piketty’s book that the economics profession belatedly began to turn its back on Lucas.

The extent to which economic insecurity in the US and the UK is driven by globalisation versus policy is still under discussion – my answer would be that it is a combination of both – but the skill-biased technical change hypothesis looks to be a dead end – and a costly one at that.

Similar stories can be told about the role of household debt, finance, monetary theory and labour bargaining power and monopoly – why so much academic focus on ‘structural reform’ in the labour market but none on anti-trust policy?  Heterodox economists were warning about the connections between finance, globalisation, current account imbalances, inequality, household debt and economic insecurity in the decades before the crisis. These warnings were dismissed as unscientific – in favour of a model which excluded all of these things by design.

Are economic factors – and economic policy – partly to blame for the Brexit and Trump votes? And are academic economists, at least in part, to blame for these polices? The answer to both questions is yes. To argue otherwise is to deny Keynes’ dictum that ‘the ideas of economists and political philosophers, both when they are right and when they are wrong are more powerful than is commonly understood.’

This quote, ‘mounted and framed, takes pride of place in the entrance hall of the Institute for Economic Affairs’ – the think-tank founded, with Hayek’s encouragement, by Anthony Fisher, as a way to promote and promulgate the ideas of the Mont Pelerin Society. The Institute was a success. Fisher was, in the words of Milton Friedman, ‘the single most important person in the development of Thatcherism’.

The rest, it seems, is history.