A couple of weeks ago I tweeted a chart from The Economist which plotted the percentage increase in the foreign-born population in UK local authority areas against the number of Leave votes in that area. I also quoted the accompanying article: ‘Where foreign-born populations increased by more than 200%, a Leave vote followed in 94% of cases.’
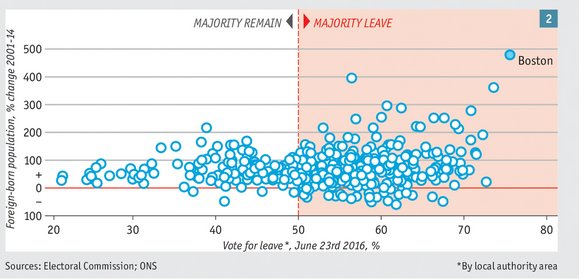
This generated lots of responses, many of which rightly pointed out the problems with the causality implied in the quote. These included the following:
- Using the percentage change in foreign-born population is problematic because this will be highly sensitive to the initial size of population.
- Majority leave votes also occurred in many areas where the number of migrants had fallen.
- Much of the result is driven by a relatively small number of outliers while the systemic relationship looks to be flat.
- The number of points where foreign-born populations had increased by more than 200% were small relative to the total sample: around twenty points out of several hundred.
Al these criticisms are valid. With hindsight, the Economist probably shouldn’t have published the chart and article – and I shouldn’t have tweeted it. But the discussion on Twitter got me interested in whether the geographical data can tell us anything interesting about the Leave vote.
I started by trying to reproduce the Economist’s chart. The time period they use for the change in foreign-born population is 2001-2014. This presumably means they used census data for the 2001 numbers and ONS population estimates for 2014. My attempt to reproduce the graph using these datasets is shown below. The data points are colour-coded by geographical region and the size of the data point represents the size of the foreign-born population in 2014 as a percentage of the total. (The chart is slightly different to the one I previously tweeted, which had some data problems.)
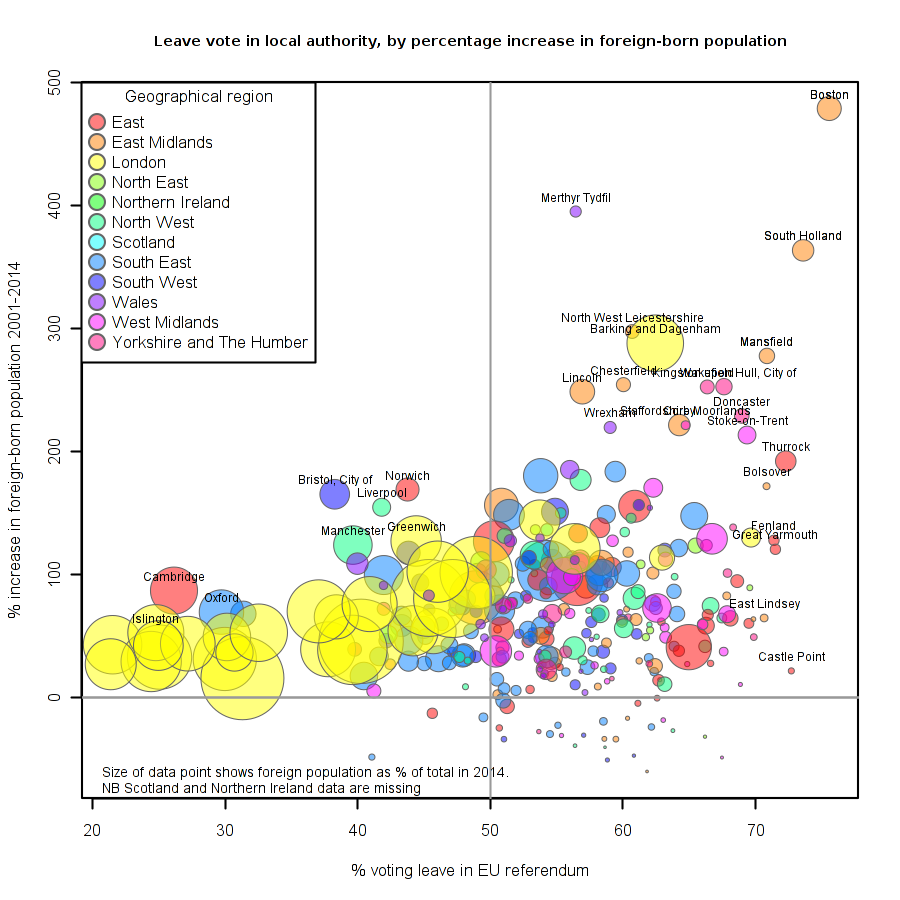
Despite the problems described above, the significance of geography in the vote is clear – this is emphasised in the excellent analysis published recently by the Resolution Foundation and by Geoff Tily at the TUC (see also this in the FT and this in the Guadian).
Of the English and Welsh regions, it is clear that the Remain vote was overwhelmingly driven by London (The chart above excludes Scotland and Northern Ireland, both of which voted to Remain). Other areas which have seen substantial growth in foreign-born populations and also voted to Remain are cities such as Oxford, Cambridge, Bristol, Manchester and Liverpool.
A better way to look at this data is to plot the percentage point change in foreign population instead of the percentage increase. This will prevent small initial foreign-born populations producing large percentage increases. The result is shown below. For this, and rest of the analysis that follows, I’ve used the ONS estimates of the foreign-born population. This reduces the number of years to 2004-2014, but excludes possible errors due to incompatibility between the census data and ONS estimates. It also allows for inclusion of Scottish data (but not data from Northern Ireland). I’ve also flipped the X and Y axes: if we are thinking of the Leave vote as the thing we wish to explain, it makes more sense to follow convention and put it on the Y axis.
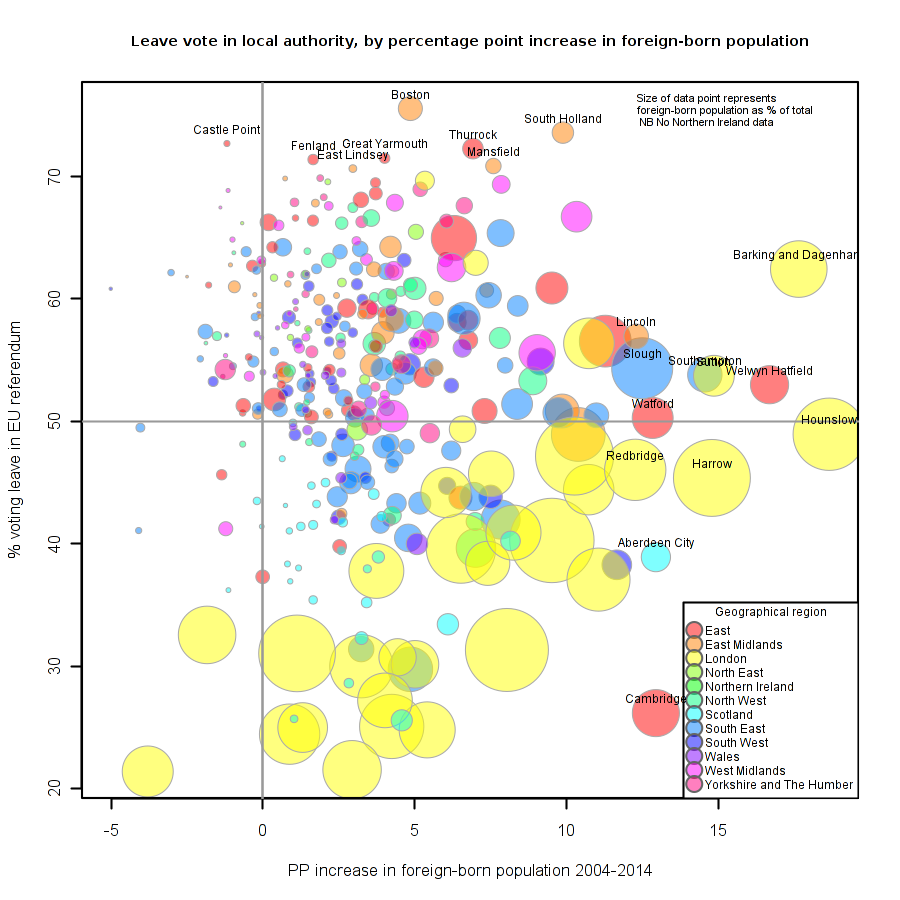
There is no statistically significant relationship between the two variables in the chart above. The divergence between London, Scotland and the rest of the UK is clear, however. There also looks to be a positive relationship between the increase in foreign-born population and the Leave vote within London. This can be seen more clearly if the regions are plotted separately.
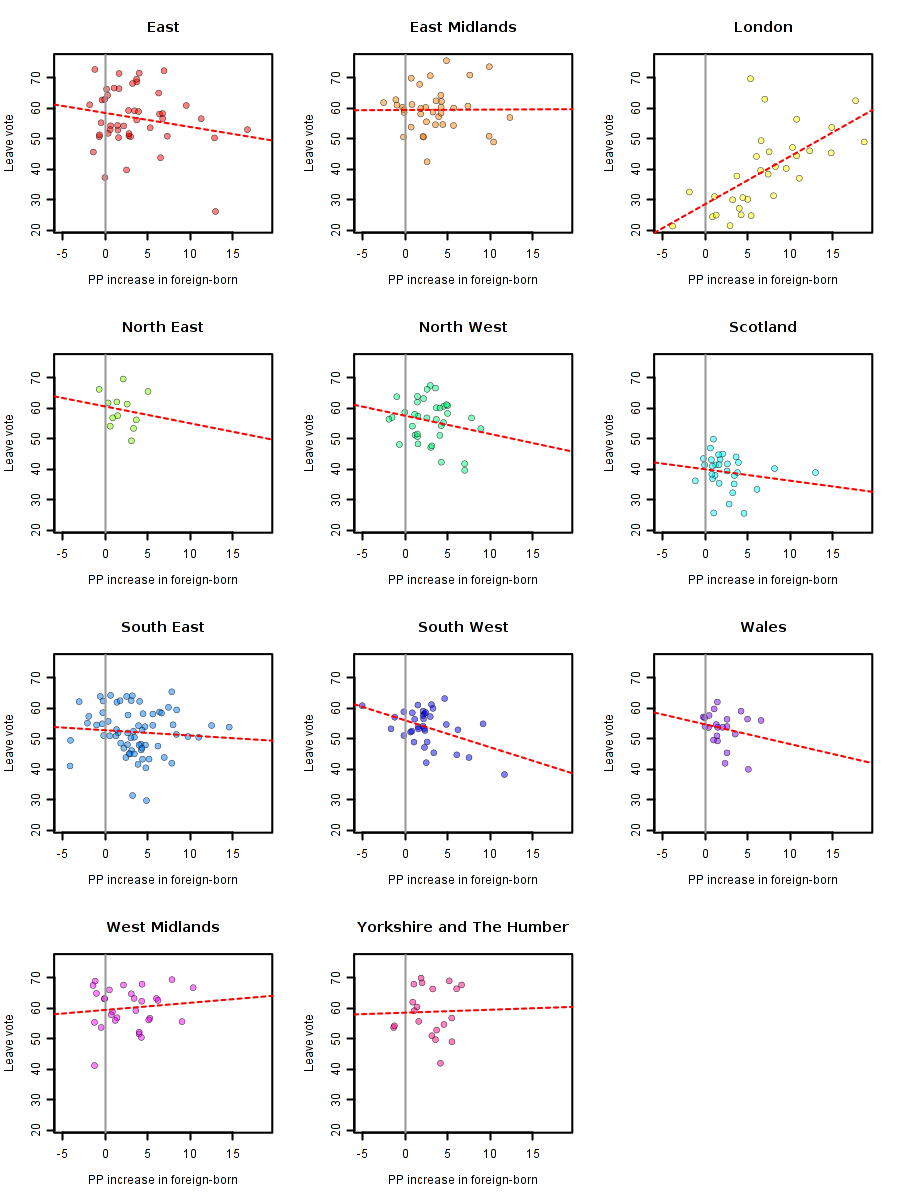
The only region in which there is statistically significant relationship in a simple regression between the two variables is London. A one percent increase in the foreign-born population is associated with a 1.5 percent increase in the Leave vote (with an R-squared of about 0.4). The chart below shows the London data in isolation.
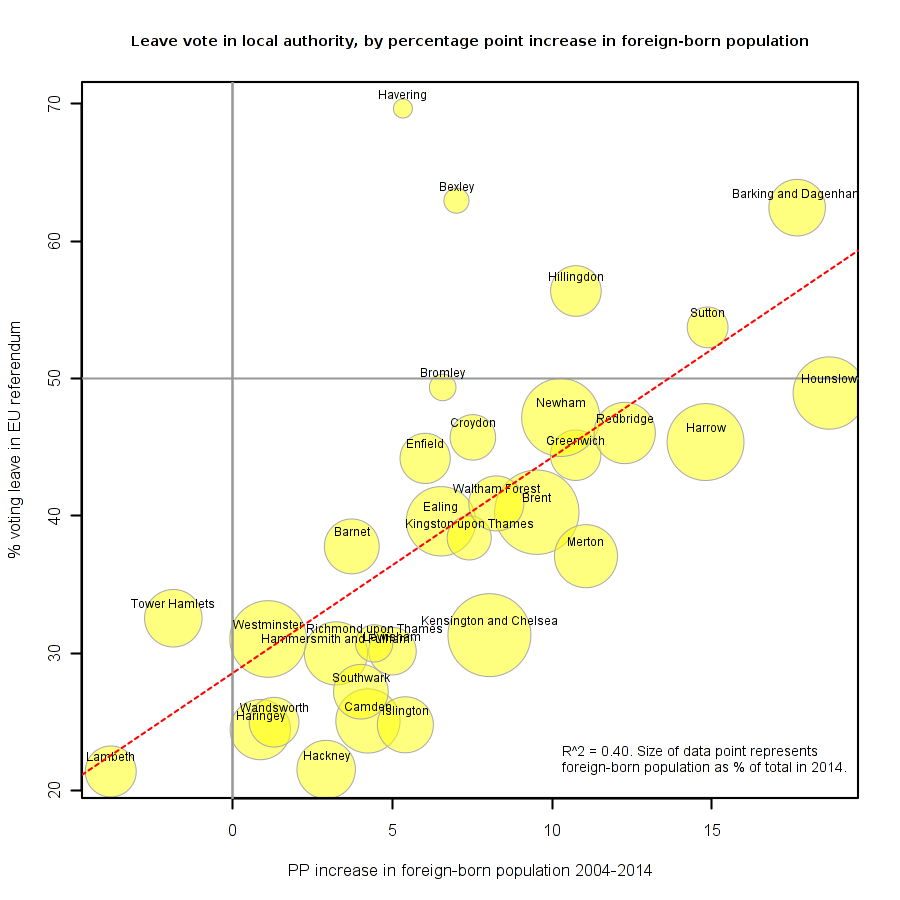
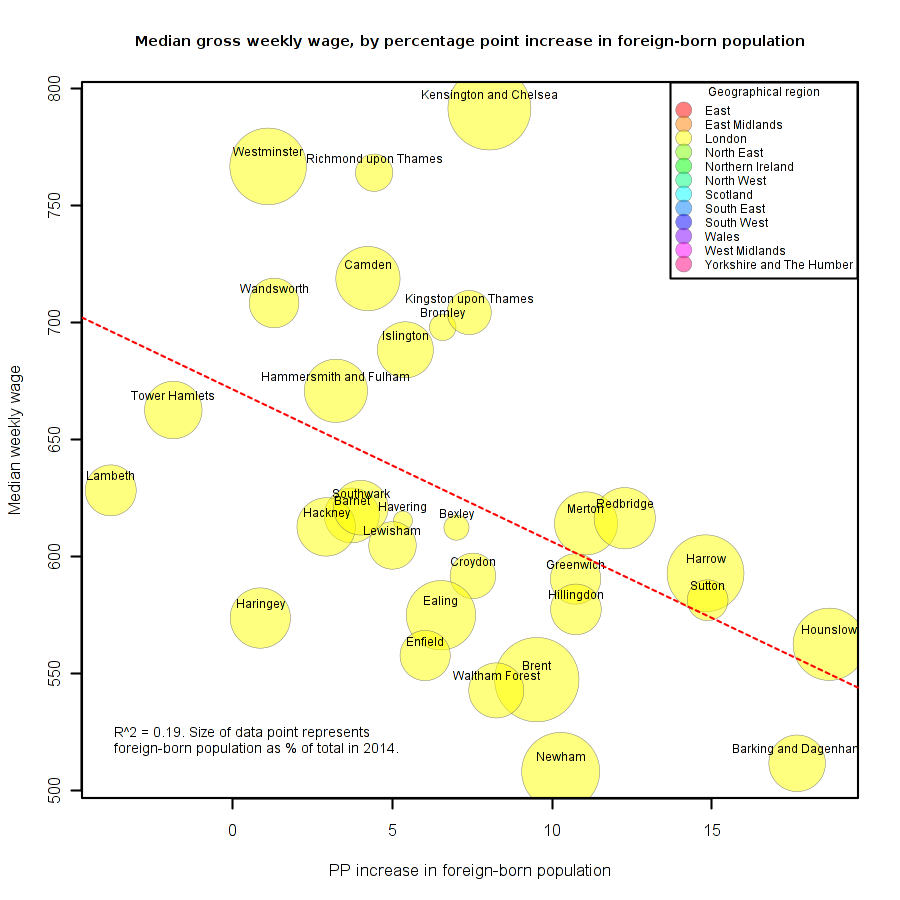
The net inflow of migrants appears to have been greatest in the outer boroughs of London – and these regions also returned highest Leave votes. There are a number of possible explanations for this. One is that new migrants go to where housing is affordable – which means the outer regions of London. These are also the areas where incomes are likely to be lower. There is some evidence for this, as shown in the chart below: there is a negative relationship – albeit a weak one – between the increase in the foreign-born population and the median wage in the area.
Returning to the UK as a whole (excluding Northern Ireland), the Resolution foundation finds that there is a statistically significant relationship between the percentage point increase in foreign-born population and Leave vote when the size of the foreign-born population is controlled for. This is confirmed in the following simple regression, where FB.PP.Incr is the percentage point increase in the foreign-born population and FB.Pop.Pct is the foreign-born population as a percent of the total.
Coefficients:
 Estimate Std. Error t value Pr(>|t|)
(Intercept) 57.19258 0.71282 80.235 < 2e-16 ***
FB.PP.Incr 0.90665 0.17060 5.314 1.87e-07 ***
FB.Pop.Pct -0.64344 0.05984 -10.752 < 2e-16 ***
---
Signif. codes: 0 ~***~ 0.001 ~**~ 0.01 ~*~ 0.05 ~.~ 0.1 ~ ~ 1

Residual standard error: 9.002 on 363 degrees of freedom
Multiple R-squared: 0.2475, Adjusted R-squared: 0.2433
F-statistic: 59.69 on 2 and 363 DF, p-value: < 2.2e-16
It is clear that controlling for the foreign-born population is, in large part, controlling for London. This is illustrated in the chart below which shows the foreign-born population as a percentage of the total for each local authority in 2014, grouped by broad geographical region. The boxplots in the background show the mean and interquartile ranges of foreign-born population share by region. The size of the data points represents the size of the electorate in that local authority.
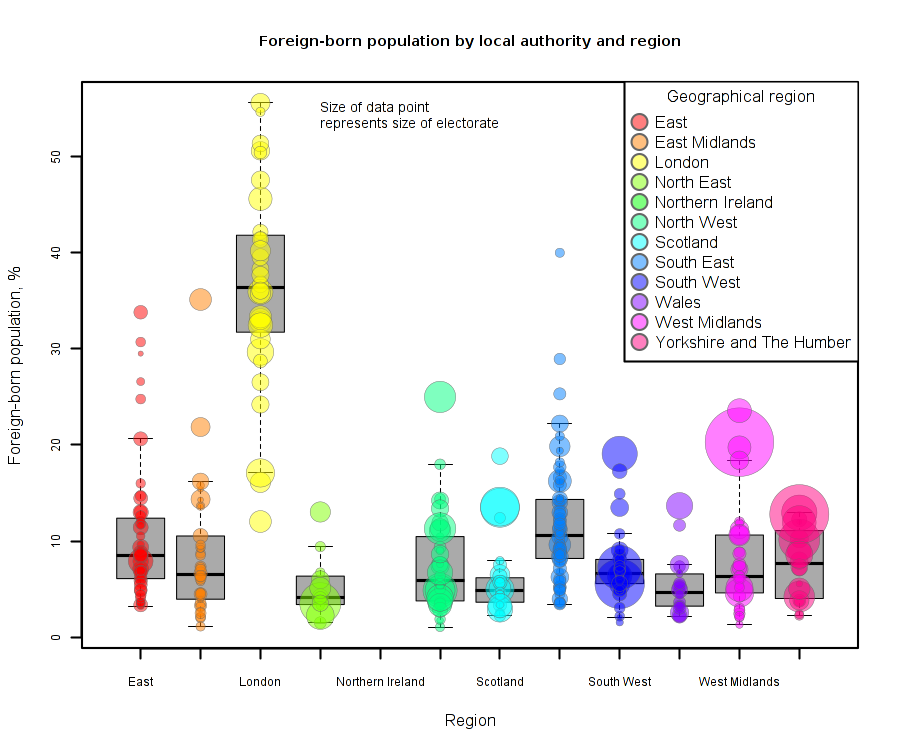
This highlights a problem with the analysis so far – and for others doing regional analysis on the basis of local authority data. By taking each region as a single data point, statistical analysis misses the significance of differences in the size of electorates. This is important because it means, for example, that the Leave vote of 57% from Richmondshire, North Yorksire with around 27,000 votes cast is given the same weight as the Leave vote of 57% in County Durham, with around 270,000 votes cast.
This can be overcome by constructing an index of referendum voting weighted by the size of the electorate in each area. This index is constructed so that it is equal to zero where the Leave vote was 50%, negative for areas voting Remain, and positive for areas voting Leave. The magnitude of the index represents the strength of the contribution to the overall result. Plotting this index against the percentage point change in the foreign population produces the following chart. Data point sizes represent the number of votes in each area.
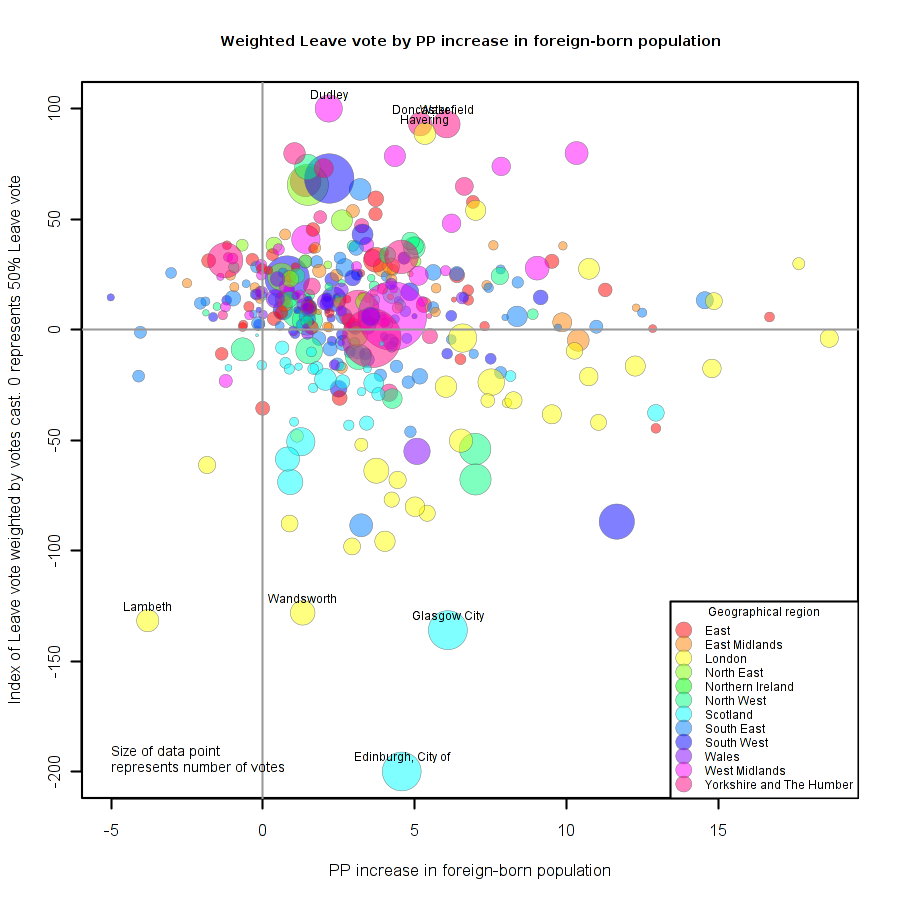
Again, there is no statistically significant relationship between the two variables, but as with the unweighted data, when controlling for the foreign population, a positive relationship does exist between the increase in foreign-born and Leave votes.
The outliers are different to those seen in the unweighted voting data, however – particularly in areas with a strong leave vote. This can be seen more clearly by removing the two areas with the strongest Remain votes: London and Scotland. The data for the rest of England and Wales only are shown below.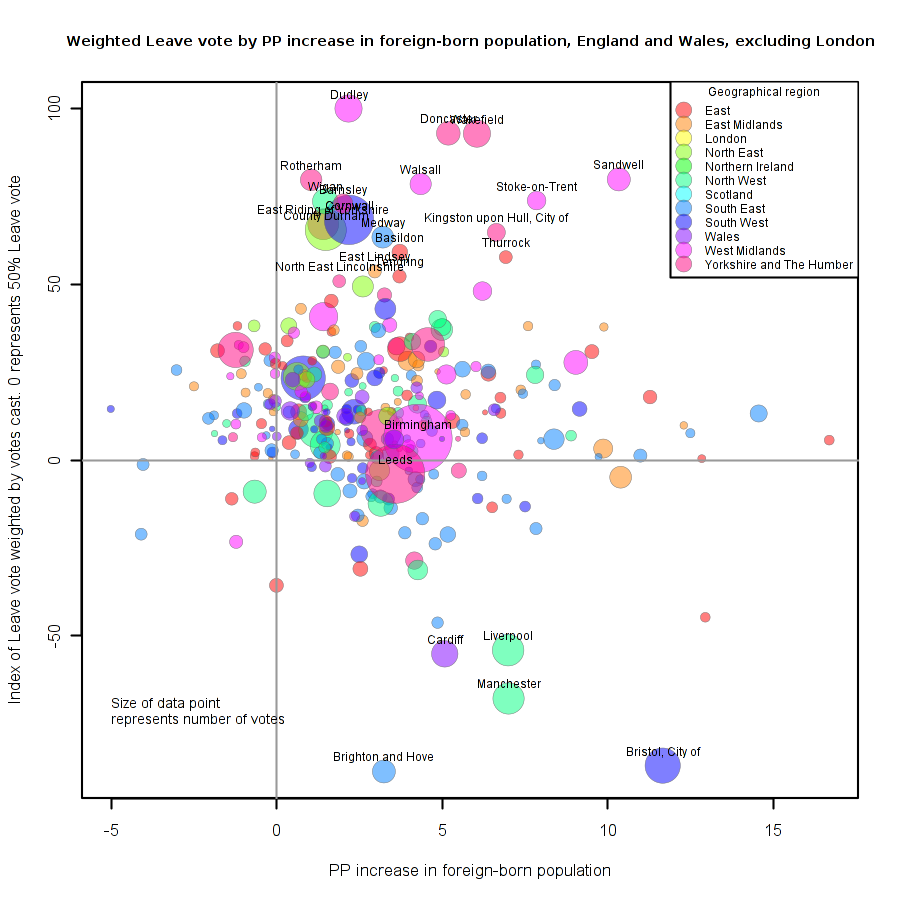
There is a clear split between the strong Leave outliers and the strong Remain outliers. The latter are Bristol, Brighton, Manchester, Liverpool and Cardiff. When weighted by size of vote, The previous outliers for Leave – Eastern areas such as Boston and South Holland – are replaced by towns and cities in the West Midlands and Yorkshire and with the counties of Cornwall and County Durham.
Overall, while there is a relationship between net migration inflows and Leave votes – at least when controlling for the size of the foreign-born population – it is only a small part of the story. The most compelling discussions I’ve seen of the underlying causes of the Leave vote are those which emphasise the rise in precarity and the loss of social cohesion and identity in the lives of working people, such as John Lanchester’s piece in the London Review of Books (despite the errors), the excellent follow-up piece by blogger Flip-Chart Rick, and this piece by Tony Hockley. As Geoff Tily argues, the geographical distribution of votes strongly suggests economic dissatisfaction was a key driver of the Leave vote, which pitted ‘cosmopolitan cities’ against the rest of the country. This is compatible with the pattern shown above, where the strongest Leave votes are concentrated in ex-industrial areas and the strongest Remain votes in the ‘cosmopolitan cities’.
The chart below shows the weighted Leave vote plotted against median gross weekly pay.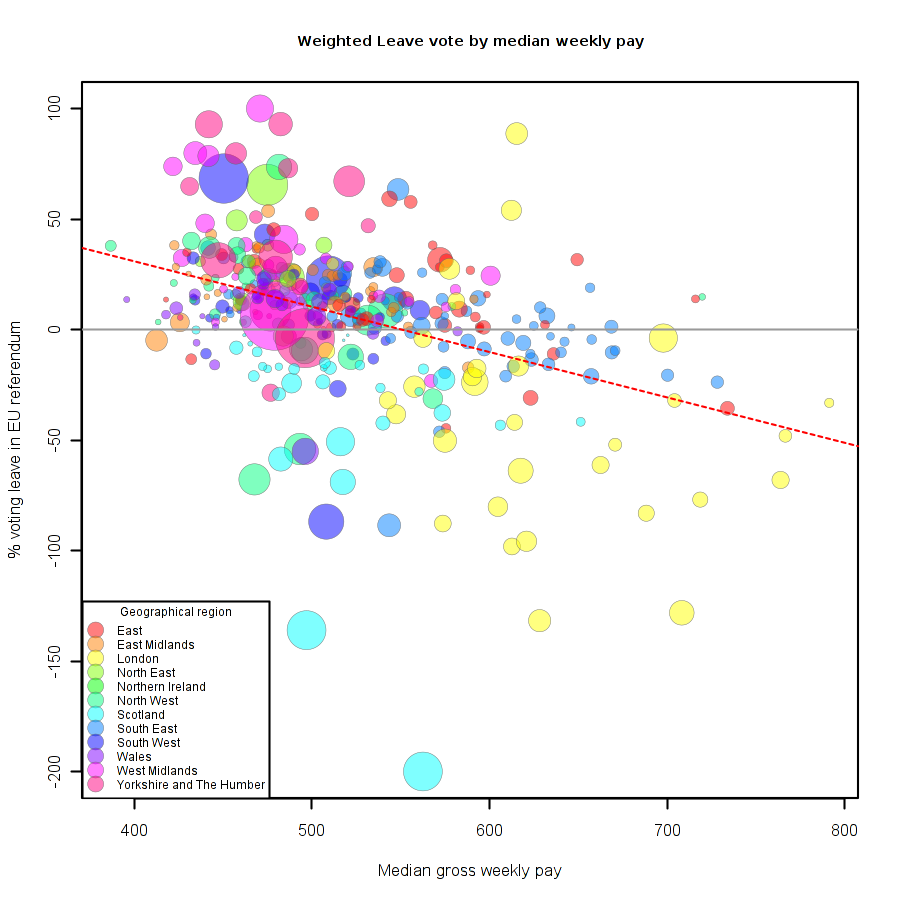
Scotland as a whole is once again the outlier, while much of the relationship appears to be driven by London, where wages are higher and the majority voted Remain. Removing these two regions gives the following graph.
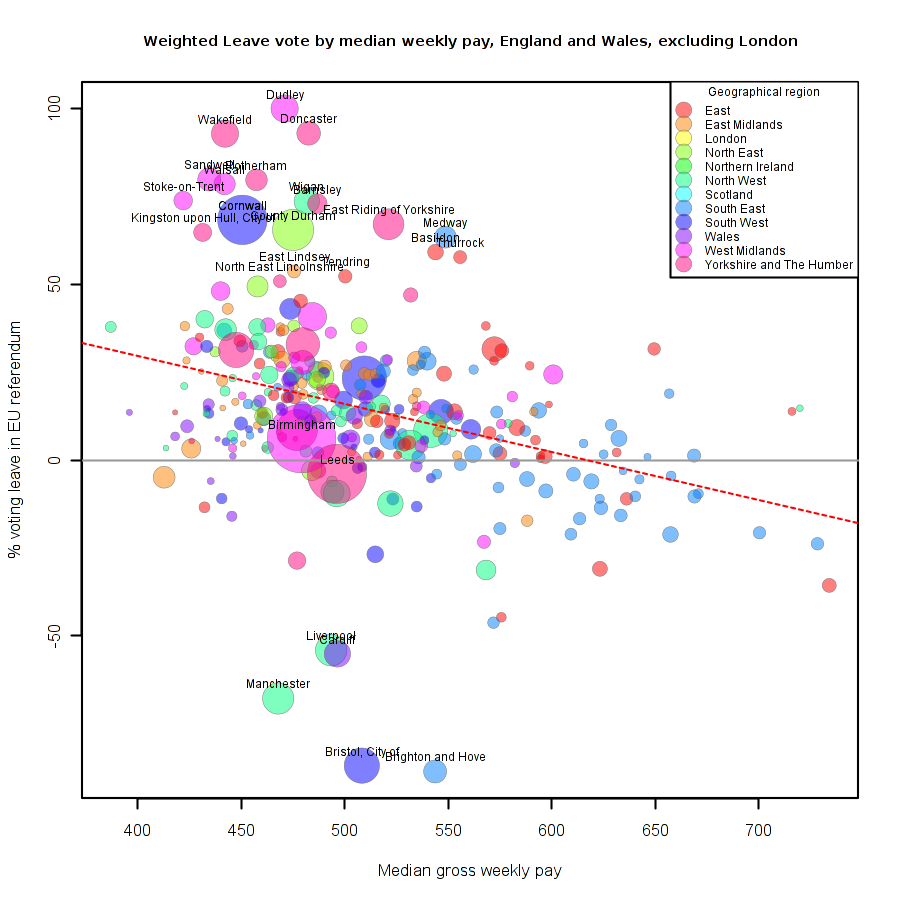
Aside from the outlier Remain cities, there is a negative relationship between median pay and weighted Leave votes. The statistical strength of this relationship is relatively weak, however.
Putting all the variables together produces the following regression result:
Coefficients:
 Estimate Std. Error t value Pr(>|t|)
(Intercept) 80.98722 12.18838 6.645 1.12e-10 ***
FB.PP.Incr 2.46269 0.57072 4.315 2.06e-05 ***
FB.Pop.Pct -1.61904 0.21781 -7.433 7.72e-13 ***
Median.Wage -0.12539 0.02404 -5.216 3.08e-07 ***
---
Signif. codes: 0 ‘***’ 0.001 ‘**’ 0.01 ‘*’ 0.05 ‘.’ 0.1 ‘ ’ 1

Residual standard error: 29 on 362 degrees of freedom
Multiple R-squared: 0.2977, Adjusted R-squared: 0.2919
F-statistic: 51.15 on 3 and 362 DF, p-value: < 2.2e-16
Leave votes are negatively associated with the size of the foreign-born population and with the median wage, and positively associated with increases in the foreign-born. The R^2 value of 0.3 suggests this model has some predictive power, but could certainly be improved.
Coefficients:
 Estimate Std. Error t value Pr(>|t|)
(Intercept) 107.61139 13.30665 8.087 9.97e-15 ***
FB.PP.Incr 2.92817 0.49930 5.865 1.04e-08 ***
FB.Pop.Pct -2.34394 0.27140 -8.636 < 2e-16 ***
Median.Wage -0.14360 0.02313 -6.210 1.50e-09 ***
RegionEast Midlands -9.07601 5.44978 -1.665 0.09672 .
RegionLondon 9.44698 8.34896 1.132 0.25861
RegionNorth East -4.11112 8.02869 -0.512 0.60893
RegionNorth West -16.69448 5.51048 -3.030 0.00263 **
RegionScotland -61.65217 5.76312 -10.698 < 2e-16 ***
RegionSouth East -4.60717 4.64123 -0.993 0.32156
RegionSouth West -18.73821 5.55187 -3.375 0.00082 ***
RegionWales -27.65673 6.53577 -4.232 2.96e-05 ***
RegionWest Midlands 4.06613 5.83469 0.697 0.48633
RegionYorkshire and The Humber 4.72398 6.61676 0.714 0.47574
---
Signif. codes: 0 ‘***’ 0.001 ‘**’ 0.01 ‘*’ 0.05 ‘.’ 0.1 ‘ ’ 1

Residual standard error: 24 on 352 degrees of freedom
Multiple R-squared: 0.5323, Adjusted R-squared: 0.515
F-statistic: 30.82 on 13 and 352 DF, p-value: < 2.2e-16
Adding regional dummy variables improves the fit of the model substantially – increasing the value of R^2 to around 0.5. This suggests – unsurprisingly – there are differences between regions which are not captured in the three variables included here.
The evidence from the British Social Attitude Survey
http://www.natcen.ac.uk/news-media/press-releases/2016/june/big-majority-believe-immigration-increases-pressure-on-schools-and-hospitals/
suggests that concerns about immigration are social and not economic. And particularly the pressure that immigration puts on public services.
That would suggest that the issue is primarily one of numbers – which fits in with your conclusion that change rather than levels is important – and not the nature of immigration itself. So, for example, gentrification or an increase in student numbers would be considered in the same way as it would still mean you have to plan to be ill in order to get an appointment at the local doctors. So, for example, the prevalence of remain votes in cities with a halo of strong(ish) Leave votes around the city might be considered as the current inhabitants of the city being able to access public services including housing whilst the previous inhabitants of the city and their children felt that they did not have sufficient access to good public services.
I should say that immigration is an obvious reason for people to ascribe concern about public services to. However, the reason why – for example it is not possible to get your child into your first choice school, or have to wait for NHS help etc, get on benefits etc is unlikely just to depend on the level of demand. Supply and resource allocation are also likely to be major factors.
The alternative explanation that it is an economic rather than a social phenomenon with a group of people left behind by globalisation, for example, seems a little unlikely. As the IFS set out clearly inequality in the bottom half of the distribution has improved over the past 25 years.
http://www.ifs.org.uk/publications/8371
And a lot of the relative (and absolute) improvement at the bottom is due to employment with labour market policies – over a number of governments – helping to ensure that the biggest improvement amongst the people who started in the worst position. It does seem that the oft-repeated maxim ‘Work is the best form of welfare’ is a fair description of what it going on.
Similarly, the question of whether it is the nature of work – whether it is more insecure for example, does not seem a totally convincing reason. The OECD Employment Outlook and the Eurofound’s European Working Conditions Survey provide some evidence of this from an international perspective.
Domestic evidence on both the progressive nature of employment rate growth and also job insecurity is provided in the following links:-
Click to access Debate%204%20BILL%20WELLS.pdf
Click to access zero-hours-contracts-supplementary-analysis-note.pdf
LikeLiked by 1 person