Rob Calvert Jump and Jo Michell
In a recent tweet, George Osborne celebrated the fact that the UK now has a surplus on the government’s current budget. Osborne cited an FT article noting that “… deficit reduction has come at the cost of an unprecedented squeeze in public spending. That squeeze is now showing up in higher waiting times in hospitals for emergency treatment, worse performance measures in prisons, severe cuts in many local authorities and lower satisfaction ratings for GP services.”
It is a measure of how far the debate has departed from reality that widespread degradation of essential public services can be regarded as cause for celebration.
The official objective of fiscal austerity was to put the public finances back on a sustainable path. According to this narrative, government borrowing was out of control as a result of the profligacy of the Labour government. Without a rapid change of policy, the UK faced a fiscal crisis caused by bond investors taking fright and interest rates rising to unsustainable levels.
Is this plausible? To answer, we present alternative scenarios in which actual and projected austerity is significantly reduced and examine the resulting outcomes for national debt.
Public sector net debt (the headline government debt figure) in any year is equal to the debt at the end of the previous year plus the deficit plus adjustments,

where PSND is the public sector net debt at the end of financial year, PSNB is total public sector borrowing (the deficit) over the same year, and ADJ is any non-borrowing adjustment. This adjustment can be inferred from the OBR’s figures for both actual data and projections. In our simulations, we simply take the OBR adjustment figures as constants. Given an assumption about the nominal size of the deficit in each future year, we can then calculate the implied size of the debt over the projection period.
What matters is not the size of the debt in money terms, but as a share of GDP. We therefore also need to know nominal GDP for each future year in our simulations. This is less straightforward because nominal GDP is affected by government spending and taxation. Estimates of the magnitude of this effect – known as the fiscal multiplier – vary significantly. The OBR, for instance, assumes a value of 1.1 for the effect of current government spending. In order to avoid debate on the correct size of the nominal multiplier, we assume it is equal to zero.[1] This is a very conservative estimate and, like the OBR, we believe the correct value is greater than one. The advantage of this approach is that we can use OBR projections for nominal GDP in our simulations without adjustment.
We simulate three alternative scenarios in which the pace of actual and predicted deficit reduction is slowed by a third, a half and two thirds respectively.[2] The evolution of the public debt-to-GDP ratio in each scenario is shown below, alongside actual figures and current OBR projections based on government plans.

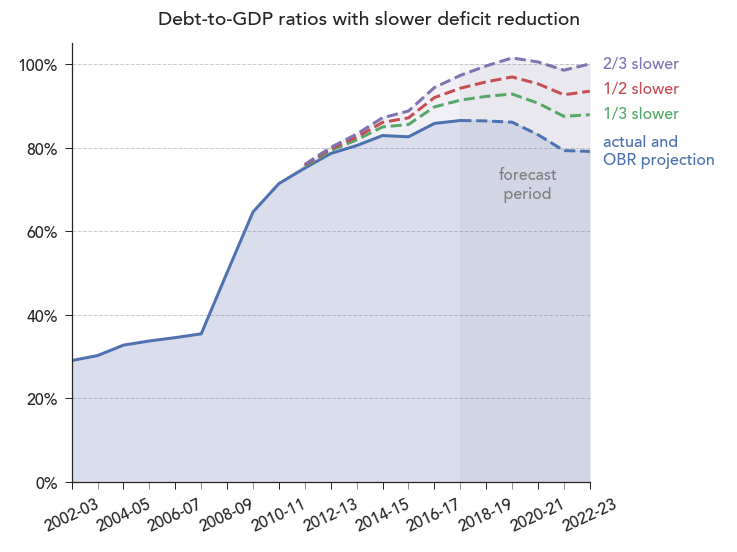
Despite the fact that the deficit is substantially higher in our alternative scenarios, there is little substantive variation in the implied time paths for debt-to-GDP ratios. In our scenarios, the point at which the debt-to-GDP ratio reaches a peak is delayed by around two years. If the speed of deficit reduction is halved, public debt peaks at around 97% of GDP in 2019-20, compared to the OBR’s projected peak of 86% in the current fiscal year. Given the assumption of zero nominal multipliers, these projections are almost certainly too high: relaxing austerity would have led to higher growth and lower debt-to-GDP ratios.
Now consider the difference in spending.
Halving the speed of deficit reduction would have meant around £10 billion in extra spending in 2011-12, £8 billion in 2012-13, £19 billion in 2013-14, £21 billion in 2014-15, £29 billion extra in 2015-16, and £37 billion extra in 2016-17. To put these figures into context, £37 billion is around 30% of total health expenditure in 2016-17. The bedroom tax, on the other hand, was initially estimated to save less than £500 million per year. These are large sums of money which would have made a material difference to public expenditure.
Would this extra spending have led to a fiscal crisis, as supporters of austerity argue? It is hard to see how a plausible argument can be made that a crisis is substantially more likely with a debt-to-GDP ratio of 97% than of 86%. Several comparable countries maintain higher debt ratios without any hint of funding problems: in 2017, the US figure was around 108%, the Belgian figure around 104%, and the French figure around 97%.
It is now beyond reasonable doubt that austerity led to increases in mortality rates – government cuts caused otherwise avoidable deaths. These could have been avoided without any substantial effect on the debt-to-GDP ratio. The argument that cuts were needed to avoid a fiscal crisis cannot be sustained.
[1] There is surprisingly little research on the size of nominal multipliers – most work focuses on real (i.e. inflation adjusted) multipliers.
[2] We calculate the actual (past years) or projected (future years) percentage change in the nominal deficit from the OBR figures and reduce this by a third, a half and two thirds respectively. The table below provides details of the middle projection where the pace of nominal deficit reduction is reduced by half.


v good!
I wish we knew more about something I don’t have a name for, which is somewhat different to the government expenditure multiplier, but I think more important.
If I was sat in the Treasury trying to close the deficit, I would look to see where I can make cuts. What I’d like to know is how each £ of cuts translates into a £ off the deficit.
The standard way of estimating that (I think – please correct me if I am wrong) is to put a number on the government expenditure multiplier and combine that with some estimates of what % of marginal change in GDP is taxed.
The bit I think this misses is the relationship between discretionary cuts (which is the instrument that the Treasury wields) and the total change in government expenditure. One £ of cuts does not imply a one-for-one reduction in government expenditure, perhaps because (for example) the cuts involve making people redundant who will then claim welfare benefits, or because saving money in one place (e.g. cutting maintenance budgets) increases costs somewhere else (e.g. repairing stuff after it has broken) – there are various stories about one might tell about how trying to save money is education or health just shifts costs elsewhere. Now OK one could also cut welfare payments or just refuse to meet those costs shifted elsewhere, so the full story gets more complicated, but whatever it is, there will be some empirical relationship between total discretionary cuts and resulting change in total expenditure.
I think this number would be very powerful because the discretionary cuts are what imposes pain, if we knew the price of deficit reduction (e.g. it takes £3 of pain to reduce the deficit by £1) then we’d be better placed to decide whether that’s a price worth paying. I’d love to see some good estimates of what the price of £1 of deficit reduction was since 2007.
LikeLiked by 3 people
“there are various stories about one might tell about how trying to save money is education or health just shifts costs elsewhere. Now OK one could also cut welfare payments or just refuse to meet those costs shifted elsewhere, so the full story gets more complicated, but whatever it is, there will be some empirical relationship between total discretionary cuts and resulting change in total expenditure.”
Here is a good article on this if you haven’t seen it: https://www.jacobinmag.com/2017/03/fiscal-conservative-social-services-austerity-save-money/
LikeLiked by 3 people
The entire “debt” conversation needs to be informed by this:
http://rooseveltinstitute.org/federal-budget-not-like-household-budget-heres-why/
LikeLike